
Volume Profile is a charting method that shows how much volume was traded at each price level over a specified period. Unlike traditional volume bars that show volume per time period, Volume Profile shows volume per price level, revealing where the market has found acceptance and where it has rejected price.
Core Volume Profile Concepts
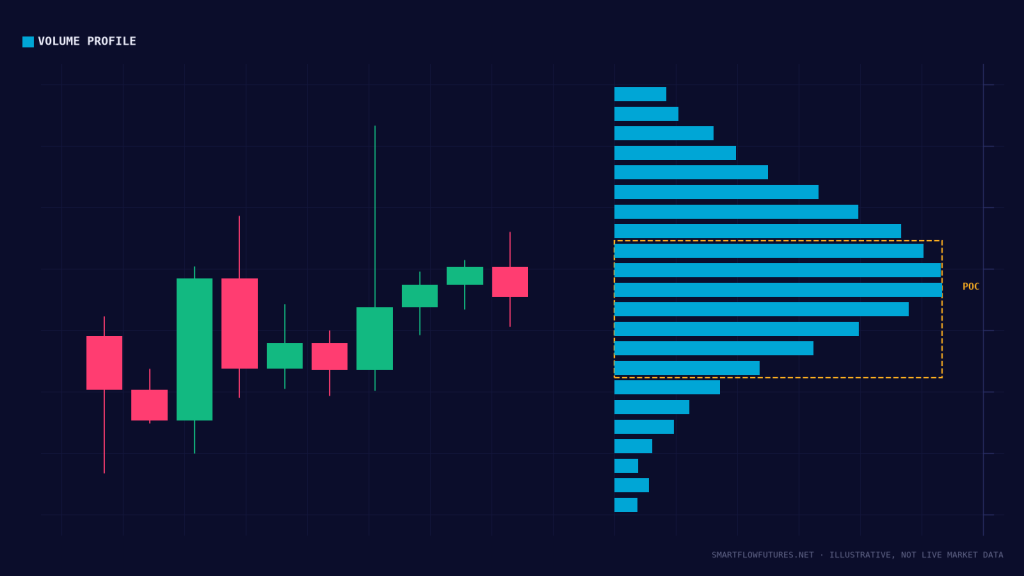
Point of Control (POC):
The price level with the highest traded volume. Represents the price where the most agreement between buyers and sellers occurred. Acts as a magnet for price and often provides support or resistance.
Value Area (VA):
The price range containing a specified percentage (typically 70%) of total volume. Represents the zone where most trading activity occurred. Prices within the value area are considered “fair” by the market.
Value Area High (VAH):
The upper boundary of the value area. Often acts as resistance when price approaches from below. Breaking above VAH can signal acceptance of higher prices.
Value Area Low (VAL):
The lower boundary of the value area. Often acts as support when price approaches from above. Breaking below VAL can signal acceptance of lower prices.
High Volume Nodes (HVN):
Price levels with significant volume concentration. Markets tend to be drawn toward HVNs. Price often consolidates or reverses at these levels.
Low Volume Nodes (LVN):
Price levels with minimal volume. Price tends to move quickly through LVNs. These areas offer little support or resistance.
Types of Volume Profile
Session Profile:
Shows volume profile for a single trading session. Useful for intraday trading reference. Each day has its own profile.
Composite Profile:
Aggregates volume over multiple sessions (days, weeks, months). Shows longer-term value areas. Useful for swing and position trading.
Fixed Range Profile:
User-defined range (specific dates or price swings). Useful for analyzing specific moves or ranges. Flexible application for various analyses.
Visible Range Profile:
Automatically adjusts to show profile for the visible chart range. Changes as you scroll or zoom. Convenient for quick analysis.
Trading with Volume Profile
Strategy 1: Value Area Rotation
When price is within the value area, expect rotation between VAH and VAL. Buy near VAL, sell near VAH. Profit from mean reversion within the range.
Strategy 2: Value Area Breakout
When price breaks above VAH with conviction, expect continuation higher. When price breaks below VAL with conviction, expect continuation lower. Trade in the direction of the breakout.
Strategy 3: POC Magnet
Price often returns to test the POC. Use POC as a target when price moves away from it. Also useful as potential support or resistance.
Strategy 4: Low Volume Node Breakout
Price moves quickly through LVNs. When approaching an LVN, expect acceleration. Use LVNs to anticipate fast moves between HVNs.
Volume Profile and SMC
Integrate Volume Profile with your SMC analysis:
Order Blocks + HVN: When an order block coincides with a high volume node, the level gains significance. More volume means more institutional interest.
FVGs + LVN: Fair Value Gaps often appear in low volume areas. This makes sense—price moved quickly (creating the gap) because there was little volume to slow it down.
Liquidity + Value Area: Liquidity outside the value area may be less well-defended. Sweeps beyond VAH or VAL can be more significant.
Multiple Timeframe Volume Profile
Like price structure, volume profiles have a hierarchy:
Monthly Profile: Shows the broadest view of value. Major levels that may hold for weeks.
Weekly Profile: Shows intermediate value. Relevant for swing trading timeframes.
Daily Profile: Shows session-by-session value. Primary reference for day trading.
Higher timeframe profiles carry more weight. The monthly POC is more significant than a daily POC.
Naked POCs
A naked POC is a Point of Control from a previous session that has not yet been tested by price. These levels often act as magnets:
Mark naked POCs on your chart. Expect price to gravitate toward them eventually. Use them as potential targets or decision points.
Volume Profile Shapes
The shape of the profile tells a story:
Normal/Balanced Profile: Bell-shaped with single POC. Indicates balanced, rotational trading. Expect continuation of range behavior.
P-Shaped Profile: High volume at top of range, low volume below. Indicates buying interest at higher prices. Often bullish continuation.
b-Shaped Profile: High volume at bottom of range, low volume above. Indicates selling interest at lower prices. Often bearish continuation.
D-Shaped Profile: Volume distributed across the range with no clear POC. Indicates directional movement without consolidation. Trend day behavior.
Setting Up Volume Profile
Most advanced platforms offer Volume Profile:
Configure your session times to match your market (futures session times). Choose appropriate value area percentage (70% is standard). Use consistent color coding across your charts. Decide on fixed, session, or composite profiles based on your trading style.
Key Takeaways
Volume Profile shows how much volume traded at each price level. POC (Point of Control) is the highest volume price—a magnet for price. Value Area (typically 70% of volume) represents where market accepts price. High Volume Nodes provide support or resistance; Low Volume Nodes allow fast movement. Combine Volume Profile levels with SMC concepts for confirmation.