
Stacked imbalances are one of the most powerful signals in Order Flow analysis. When multiple price levels in succession show one-sided volume, it reveals strong institutional conviction that often leads to significant continuation moves.
What Are Stacked Imbalances?
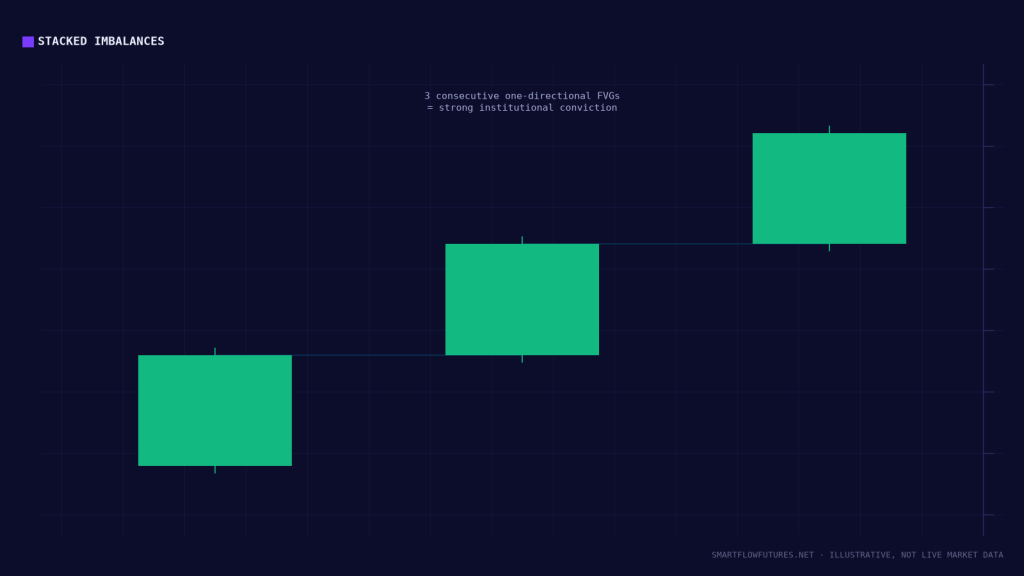
A stacked imbalance occurs when three or more consecutive price levels on a footprint chart all show volume imbalance in the same direction. Each level individually shows significantly more volume on one side (bid or ask), and these imbalances stack on top of each other.
Stacked Buying Imbalances: Three or more consecutive levels where ask volume significantly exceeds bid volume. Indicates aggressive, sustained buying. Buyers are lifting offers across multiple price levels.
Stacked Selling Imbalances: Three or more consecutive levels where bid volume significantly exceeds ask volume. Indicates aggressive, sustained selling. Sellers are hitting bids across multiple price levels.
Why Stacked Imbalances Matter
A single imbalance at one price level might be noise. But when three, four, or more consecutive levels all show the same-sided aggression, it reveals:
Institutional Participation: Retail traders rarely create stacked imbalances. The sustained aggression required indicates larger players actively pushing price.
Conviction: The institution is committing size across multiple price levels, not just testing the water.
Urgency: By hitting multiple levels aggressively, they are signaling that they need to get positioned and are willing to pay up to do so.
Identifying Stacked Imbalances
On your footprint chart:
Step 1: Set an imbalance ratio threshold (commonly 200-400%). This means one side must have 2-4x the volume of the other to qualify as imbalanced.
Step 2: Look for three or more consecutive price levels that all meet this threshold in the same direction.
Step 3: Note the location within the candle. Imbalances at the bottom of bullish candles or top of bearish candles are most significant.
Stacked Imbalance Patterns
Pattern 1: Initiation Stacks
Stacked imbalances that begin a new move. They appear at the start of a candle, often after a period of consolidation. These mark the initiation of institutional activity and often lead to significant moves.
Pattern 2: Continuation Stacks
Stacked imbalances that appear mid-move, confirming the direction. They show that institutions are adding to positions as price moves in their favor. These validate existing trends.
Pattern 3: Exhaustion Stacks
Stacked imbalances that appear at the end of a move, especially near resistance or support. Despite the aggressive activity, price fails to continue. These can signal reversal when combined with other factors.
Trading Stacked Imbalances
Entry with Stacks:
When you see stacked buying imbalances forming, consider long entries. Enter as the stacks develop or on a small pullback after formation. Stop below the stack formation. Target the next liquidity level or resistance.
When you see stacked selling imbalances forming, consider short entries. Enter as the stacks develop or on a small bounce after formation. Stop above the stack formation. Target the next support or liquidity level.
Confirmation with Stacks:
Use stacked imbalances to confirm your SMC setups. At an order block, if you see stacked imbalances in your direction, probability increases significantly. At an FVG, stacks confirm institutional interest in defending the level.
Stacked Imbalances and Market Context
Context matters for interpretation:
With Trend: Stacked imbalances in the direction of the higher timeframe trend are high probability. Trade them with confidence.
Against Trend: Stacked imbalances against the trend may signal trend change, but require more confirmation. They could also be counter-trend retracements.
At Key Levels: Stacks at significant SMC levels (order blocks, FVGs, liquidity) are most meaningful. They confirm institutional engagement at levels that matter.
Stack Quality Assessment
Not all stacks are equal:
Number of Levels: Three levels is the minimum. Four, five, or more levels indicate stronger conviction.
Imbalance Ratio: Higher ratios (400%+ vs 200%) indicate more one-sided aggression.
Total Volume: High-volume stacks are more significant than low-volume stacks.
Location: Stacks at significant price levels or during killzones carry more weight.
Common Mistakes with Stacks
Chasing Old Stacks: Stacks that formed many bars ago may have already played out. Focus on fresh stacks.
Ignoring Context: A stack against major structure is less reliable than one with structure.
Over-Filtering: Requiring too many levels or too high ratios means missing valid signals.
No Confirmation: Stacks are powerful but benefit from additional confirmation (SMC level, delta confirmation).
Key Takeaways
Stacked imbalances show three or more consecutive levels with same-sided volume aggression. They reveal institutional conviction and often precede significant moves. Initiation stacks start moves; continuation stacks confirm them. Use stacks to confirm SMC setups at key levels. Quality assessment includes number of levels, imbalance ratio, volume, and location. Fresh stacks during killzones at SMC levels provide the best opportunities.