
Market Structure : Understanding Higher Highs and Lower Lows
Market structure is the foundation of SMC trading. Before learning about order blocks, liquidity, or any advanced concepts, you must be able to read and understand the structure of price. This skill alone will transform how you see charts.
What is Market Structure?
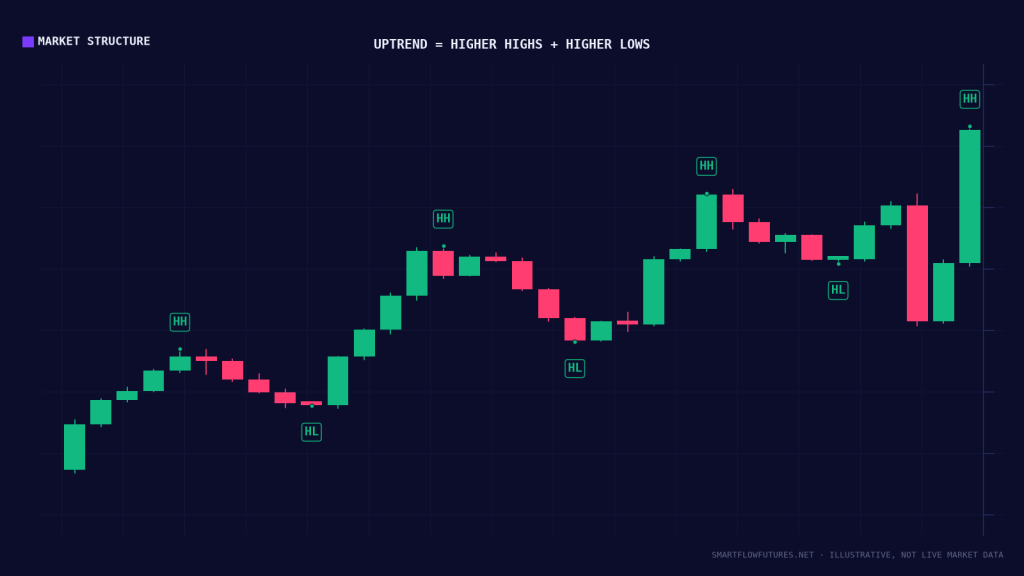
Market structure refers to the pattern of swing highs and swing lows that price creates as it moves. By analyzing these swings, we can determine whether the market is trending up, trending down, or moving sideways, and anticipate when these conditions might change.
The Four Key Labels
To read structure, we label swing points:
HH (Higher High): A swing high that’s higher than the previous swing high. Indicates bullish momentum.
HL (Higher Low): A swing low that’s higher than the previous swing low. Confirms bullish structure.
LH (Lower High): A swing high that’s lower than the previous swing high. Indicates bearish momentum.
LL (Lower Low): A swing low that’s lower than the previous swing low. Confirms bearish structure.
Bullish Market Structure
A bullish market structure consists of a series of higher highs and higher lows. Price is like a staircase going up. Each step (swing low) is higher than the last, and each peak (swing high) is higher than the previous peak.
In a bullish structure, we look for buying opportunities at or near higher lows. We expect price to continue making higher highs. The structure remains bullish until proven otherwise.
Bearish Market Structure
A bearish market structure is the opposite: lower highs and lower lows. Price is descending like a downward staircase. Each bounce (swing high) fails to reach the previous high, and each swing low goes lower than the last.
In bearish structure, we look for selling opportunities at or near lower highs. We expect price to continue making lower lows. The structure remains bearish until proven otherwise.
Identifying Swing Points
A valid swing point requires clear rejection and counter movement. A swing high forms when price makes a high, then reverses and moves lower. A swing low forms when price makes a low, then reverses and moves higher.
Not every small wiggle is a swing point. We look for significant swing points that represent genuine shifts in short-term direction. With practice, identifying these becomes intuitive.
Multi-Timeframe Structure
Market structure exists on every timeframe, and understanding the hierarchy matters.
Higher Timeframes (Daily, 4H): Show the dominant trend and major structure. These structures are stronger and take longer to break.
Lower Timeframes (1H, 15M, 5M): Show minor structure within the higher timeframe context. These can shift more quickly.
The key principle: trade in alignment with higher timeframe structure. If the daily is bullish, look for longs on lower timeframes. If the daily is bearish, look for shorts.
Structure Shifts
Markets don’t trend forever. Eventually, structure shifts from bullish to bearish or vice versa. Recognizing these shifts early provides excellent trading opportunities.
A bullish to bearish shift occurs when price fails to make a higher high, then breaks below the previous higher low, creating a lower low. This suggests the trend is changing.
A bearish to bullish shift occurs when price fails to make a lower low, then breaks above the previous lower high, creating a higher high.
We’ll explore these structure shifts in detail in upcoming articles on BOS (Break of Structure) and CHOCH (Change of Character).
Range-Bound Structure
Not all markets trend. Sometimes price moves sideways in a range, bouncing between support and resistance. In ranging conditions, highs are roughly equal and lows are roughly equal. There’s no clear trend direction. Breakouts from ranges often lead to strong trending moves.
Recognizing ranging markets is important because trend-following strategies perform poorly in ranges.
Practical Application
Here’s how to apply market structure analysis. First, start with the higher timeframe by pulling up the daily chart and labeling recent swing highs and lows. Determine: is the structure bullish (HH, HL), bearish (LH, LL), or ranging?
Then drop to your trading timeframe. If daily is bullish, look for buying opportunities on the 1H or 15M when lower timeframe structure is also bullish. If daily is bearish, look for selling opportunities when lower timeframes align.
Look for entries near swing points by waiting for price to pull back to a higher low (in uptrends) or rally to a lower high (in downtrends) before entering.
Common Mistakes
A common mistake is overcomplicating the analysis by labeling every minor swing, which just creates noise, so focus on significant swings instead. Ignoring the higher timeframe is another: trading against daily structure based on nothing more than 5-minute patterns. Some traders anticipate structure breaks rather than waiting for confirmation, entering before the structure actually shifts. And context gets ignored too, since structure alone isn’t enough. It needs to be combined with other SMC concepts for the best results.
Building the Foundation
Market structure is your first language as an SMC trader. Before moving on, practice labeling structure on historical charts across multiple timeframes. Get comfortable identifying trends, ranges, and potential shift points.
This foundation will support everything else you learn. Don’t rush. Mastery here pays dividends throughout your trading career.