
Break of Structure (BOS): How to Identify It
Break of Structure (BOS) is one of the most important concepts in SMC trading. It signals that the current trend is continuing, so you can look for trades in that direction with more confidence. Understanding BOS helps you stay on the right side of the market.
What is Break of Structure?
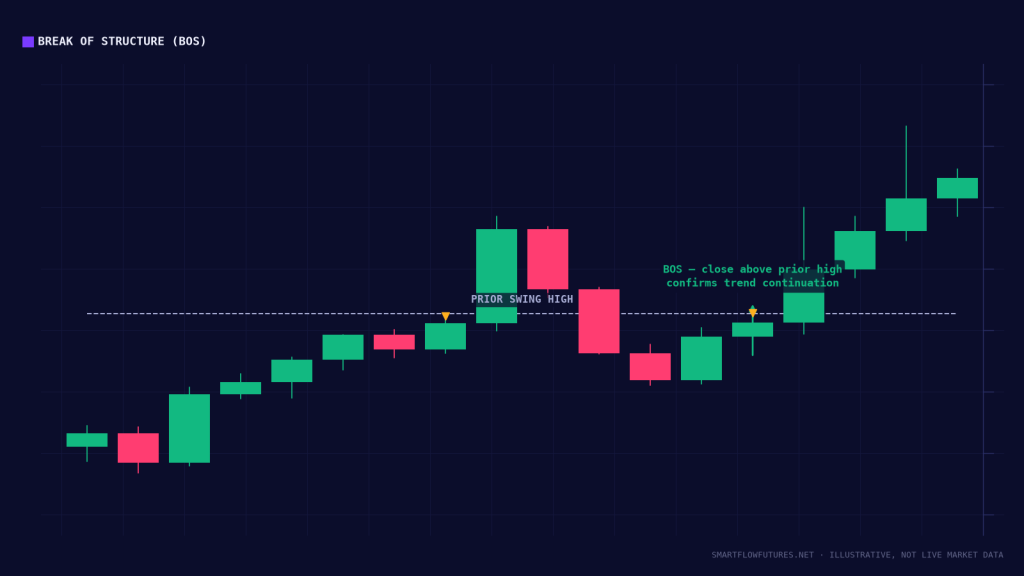
A Break of Structure occurs when price breaks beyond the previous swing point in the direction of the trend. In a bullish trend, BOS occurs when price breaks above the previous swing high. In a bearish trend, BOS occurs when price breaks below the previous swing low.
BOS confirms that the existing trend is intact and likely to continue. Each BOS tells us: “Smart money is still pushing in this direction.”
Bullish BOS
In an uptrend, price makes higher highs and higher lows. When price successfully breaks above the most recent swing high, that’s a bullish BOS. It signals that buyers remain in control and the uptrend is continuing.
After a bullish BOS, we look for opportunities to buy on pullbacks. We expect price to form a higher low and continue higher.
Bearish BOS
In a downtrend, price makes lower highs and lower lows. When price breaks below the most recent swing low, that’s a bearish BOS. It signals that sellers remain in control and the downtrend is continuing.
After a bearish BOS, we look for opportunities to sell on rallies. We expect price to form a lower high and continue lower.
The Psychology Behind BOS
Understanding why BOS works helps you trust the signal.
Previous swing points represent areas where sentiment shifted. A swing high is where buying dried up and selling began. A swing low is where selling dried up and buying began.
When price breaks through these points, it shows that the new buying or selling pressure is strong enough to overcome the previous resistance. Traders who sold at the previous high are now underwater. Their stop losses create additional buying pressure.
This cascading effect—where breaks trigger stops, which add momentum—is why trends often extend further than expected after BOS.
Trading with BOS
BOS is primarily a directional signal, not an entry trigger. It tells you which way to look for trades, not exactly when to enter.
The Process:
First, identify the trend using higher timeframe structure. Then wait for BOS to confirm the trend is continuing. Next, wait for price to pull back, ideally to an order block or key level. Enter in the direction of the BOS when lower timeframe structure confirms. Set stops beyond the recent swing point.
BOS Confirmation Levels
Not all BOS signals are equal. Start with what the higher timeframe structure indicates, since a BOS on the 5-minute chart means less if the daily is trending the opposite way. How far price has already extended matters too: a BOS after a massive move may precede a pullback rather than a continuation. Volume and conviction behind the break count as well, since weak breaks are more likely to fail.
BOS vs. False Breaks
Sometimes price briefly breaks a swing point then reverses. These false breaks, or “stop hunts,” are where institutions grab liquidity before the real move.
Signs of a potential false break include breaking by a small amount with no follow-through, occurring on low volume, happening in the opposite direction of the higher timeframe trend, and occurring at times of day with low liquidity.
We’ll cover false breaks more in our liquidity lessons, but for now, know that context matters. A BOS aligned with higher timeframe structure is more reliable.
Combining BOS with Other Concepts
BOS becomes even more powerful when combined with order blocks (entering at order blocks after BOS confirms direction), fair value gaps (using FVGs for entries within the trend), time-based analysis (BOS during high-volume sessions is more reliable), and multi-timeframe analysis (higher timeframe BOS supports lower timeframe entries).
Practical Example
Imagine NQ on the 1-hour chart shows bullish structure with recent BOS to the upside. You drop to the 15-minute and see price pulling back. There’s a bullish order block from the last push up. Price enters the order block zone, shows rejection on the 5-minute, and you enter long with stops below the order block.
The BOS gave you the directional bias, the order block gave you the entry zone, and multi-timeframe analysis gave you the confidence to take the trade.
Key Takeaways
BOS confirms trend continuation. Bullish BOS means price breaks above the previous high. Bearish BOS means price breaks below the previous low. Use BOS for directional bias, not as standalone entry signals. Combine with other SMC concepts for best results. Higher timeframe BOS is more significant than lower timeframe.