
Delta divergence occurs when price and Order Flow tell different stories. Price might be making new highs, but delta shows decreasing buying pressure. Or price is making new lows, but selling pressure is diminishing. These divergences reveal hidden information that can precede significant reversals.
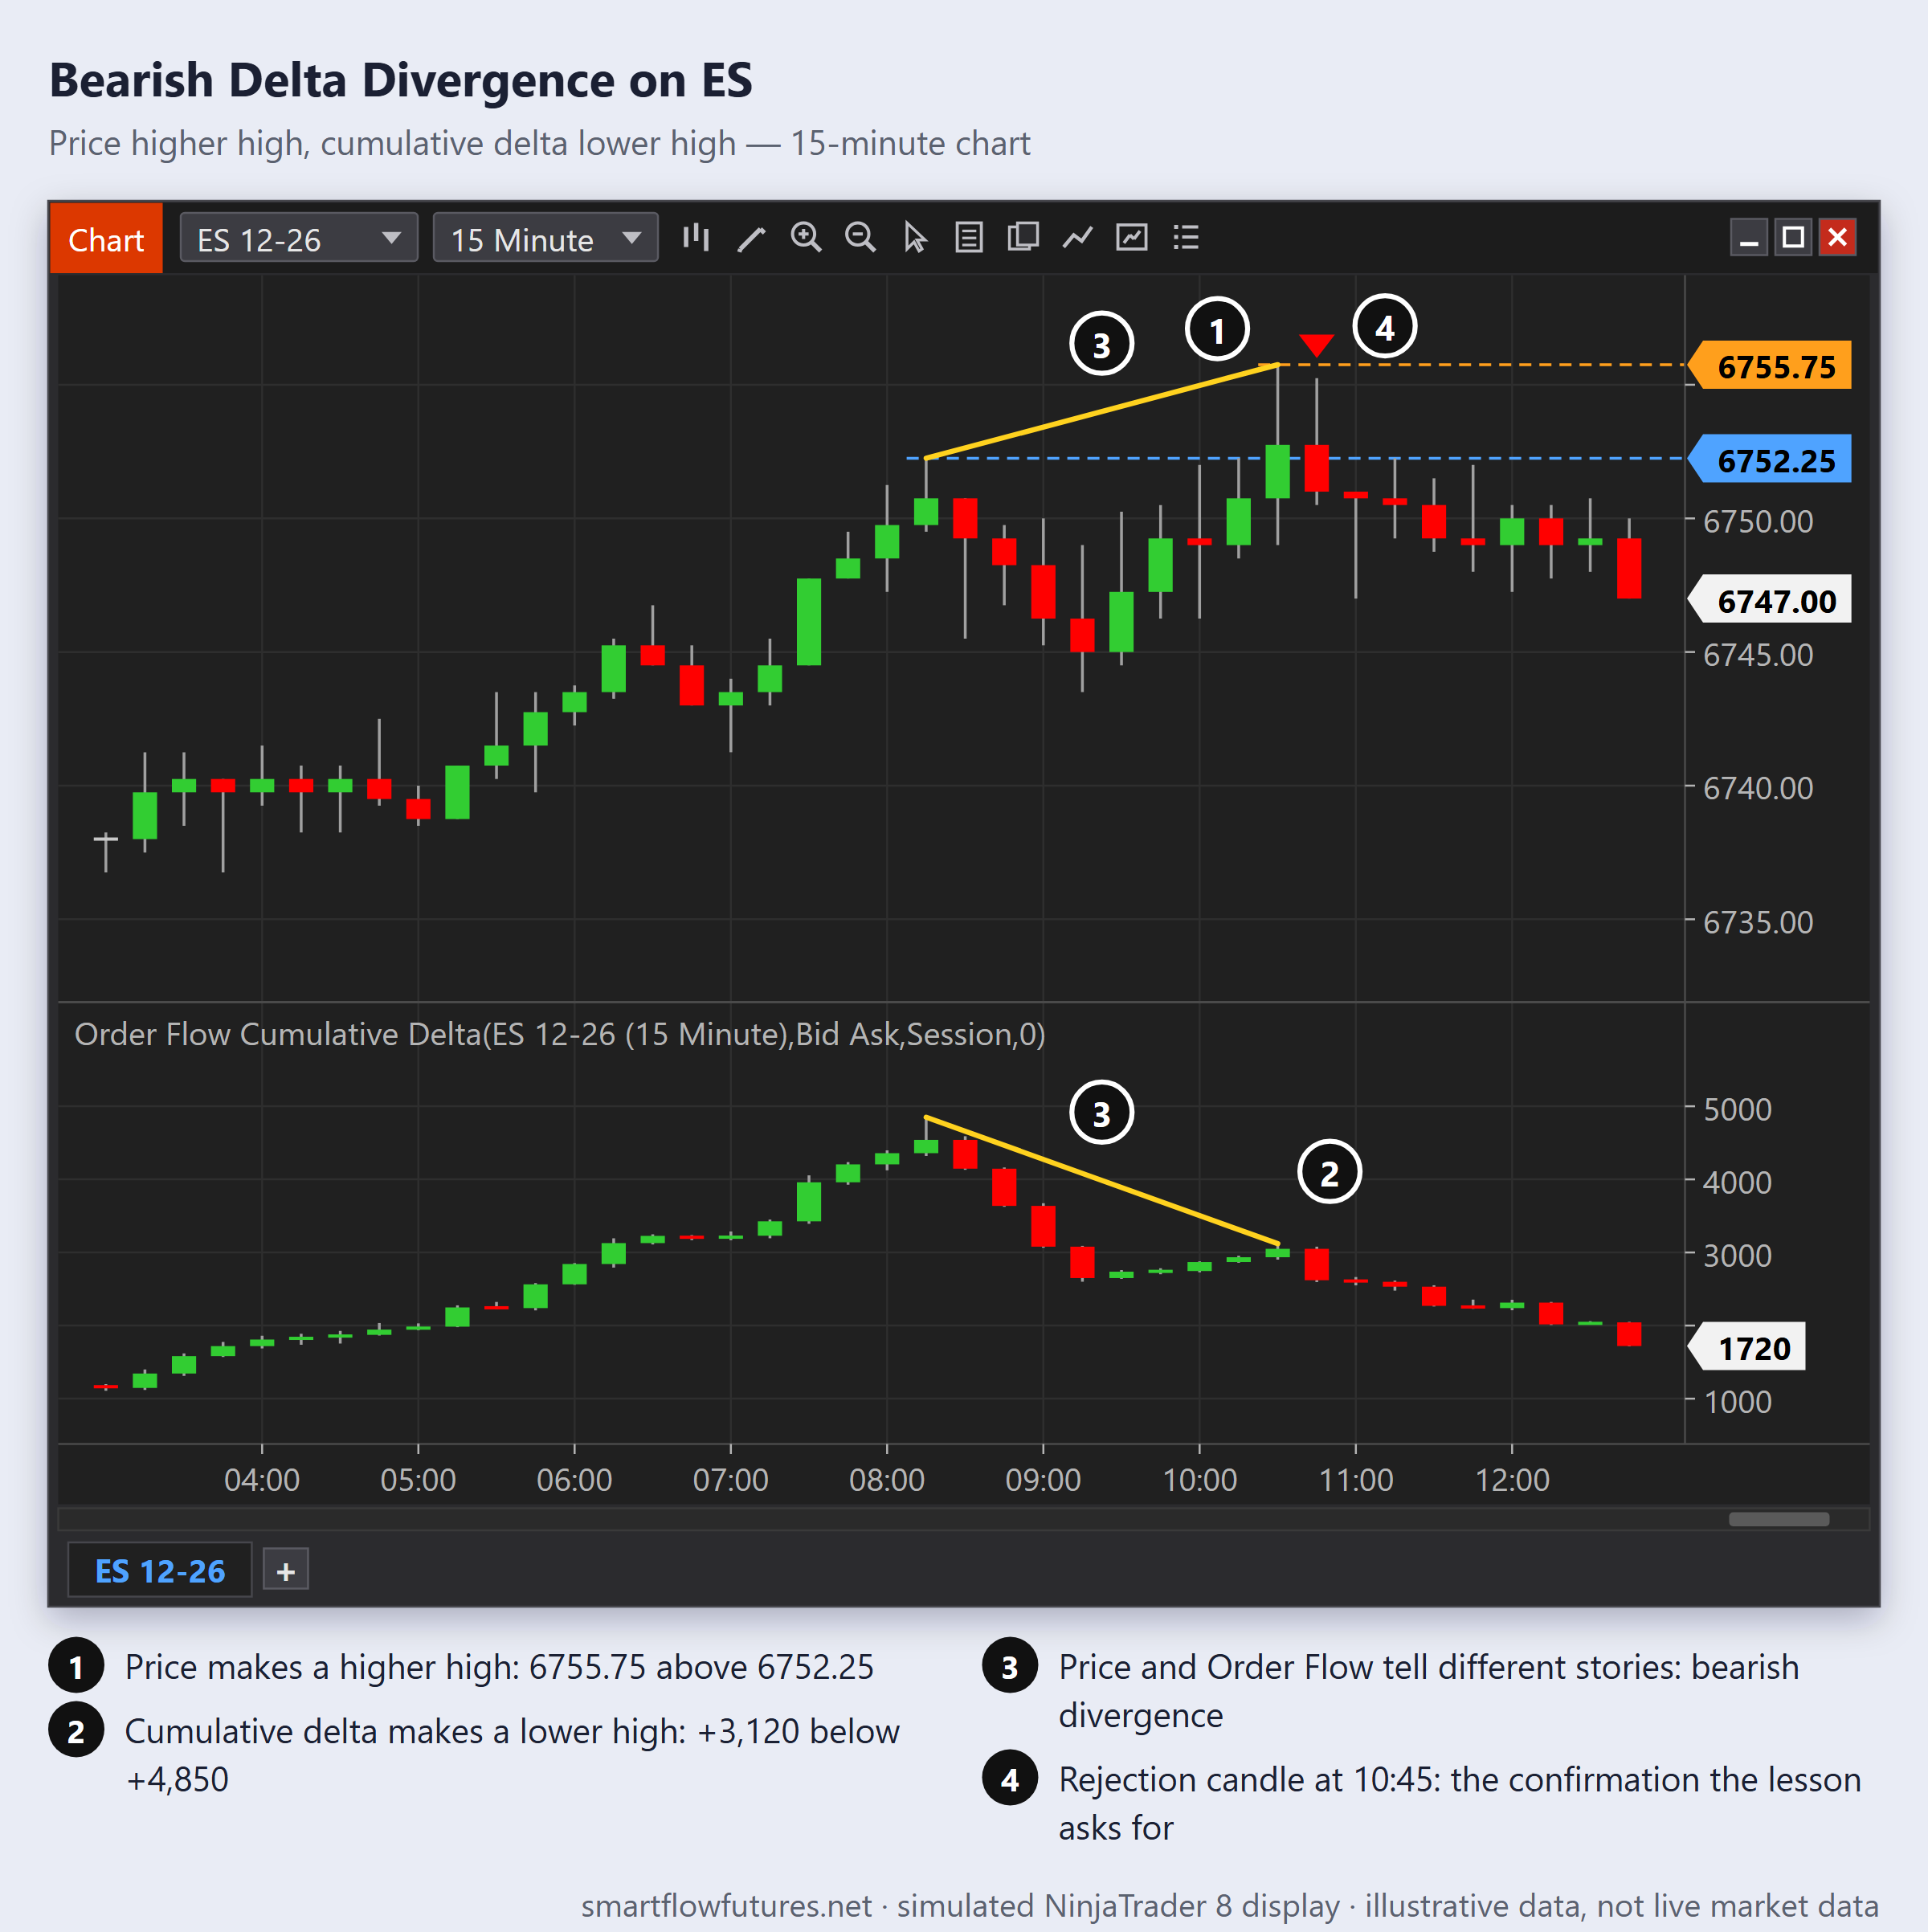
Understanding Delta Divergence
Delta measures the difference between aggressive buying volume (trades at the ask) and aggressive selling volume (trades at the bid). When price and delta move together, the market is healthy. When they diverge, something is changing beneath the surface.
Bearish Divergence: Price makes a higher high, but delta makes a lower high. Price is rising, but buyers are becoming less aggressive. The rally is losing steam even though it appears strong on the surface.
Bullish Divergence: Price makes a lower low, but delta makes a higher low. Price is falling, but sellers are becoming less aggressive. The selloff is exhausting even though it appears weak on the surface.
Types of Delta Divergence
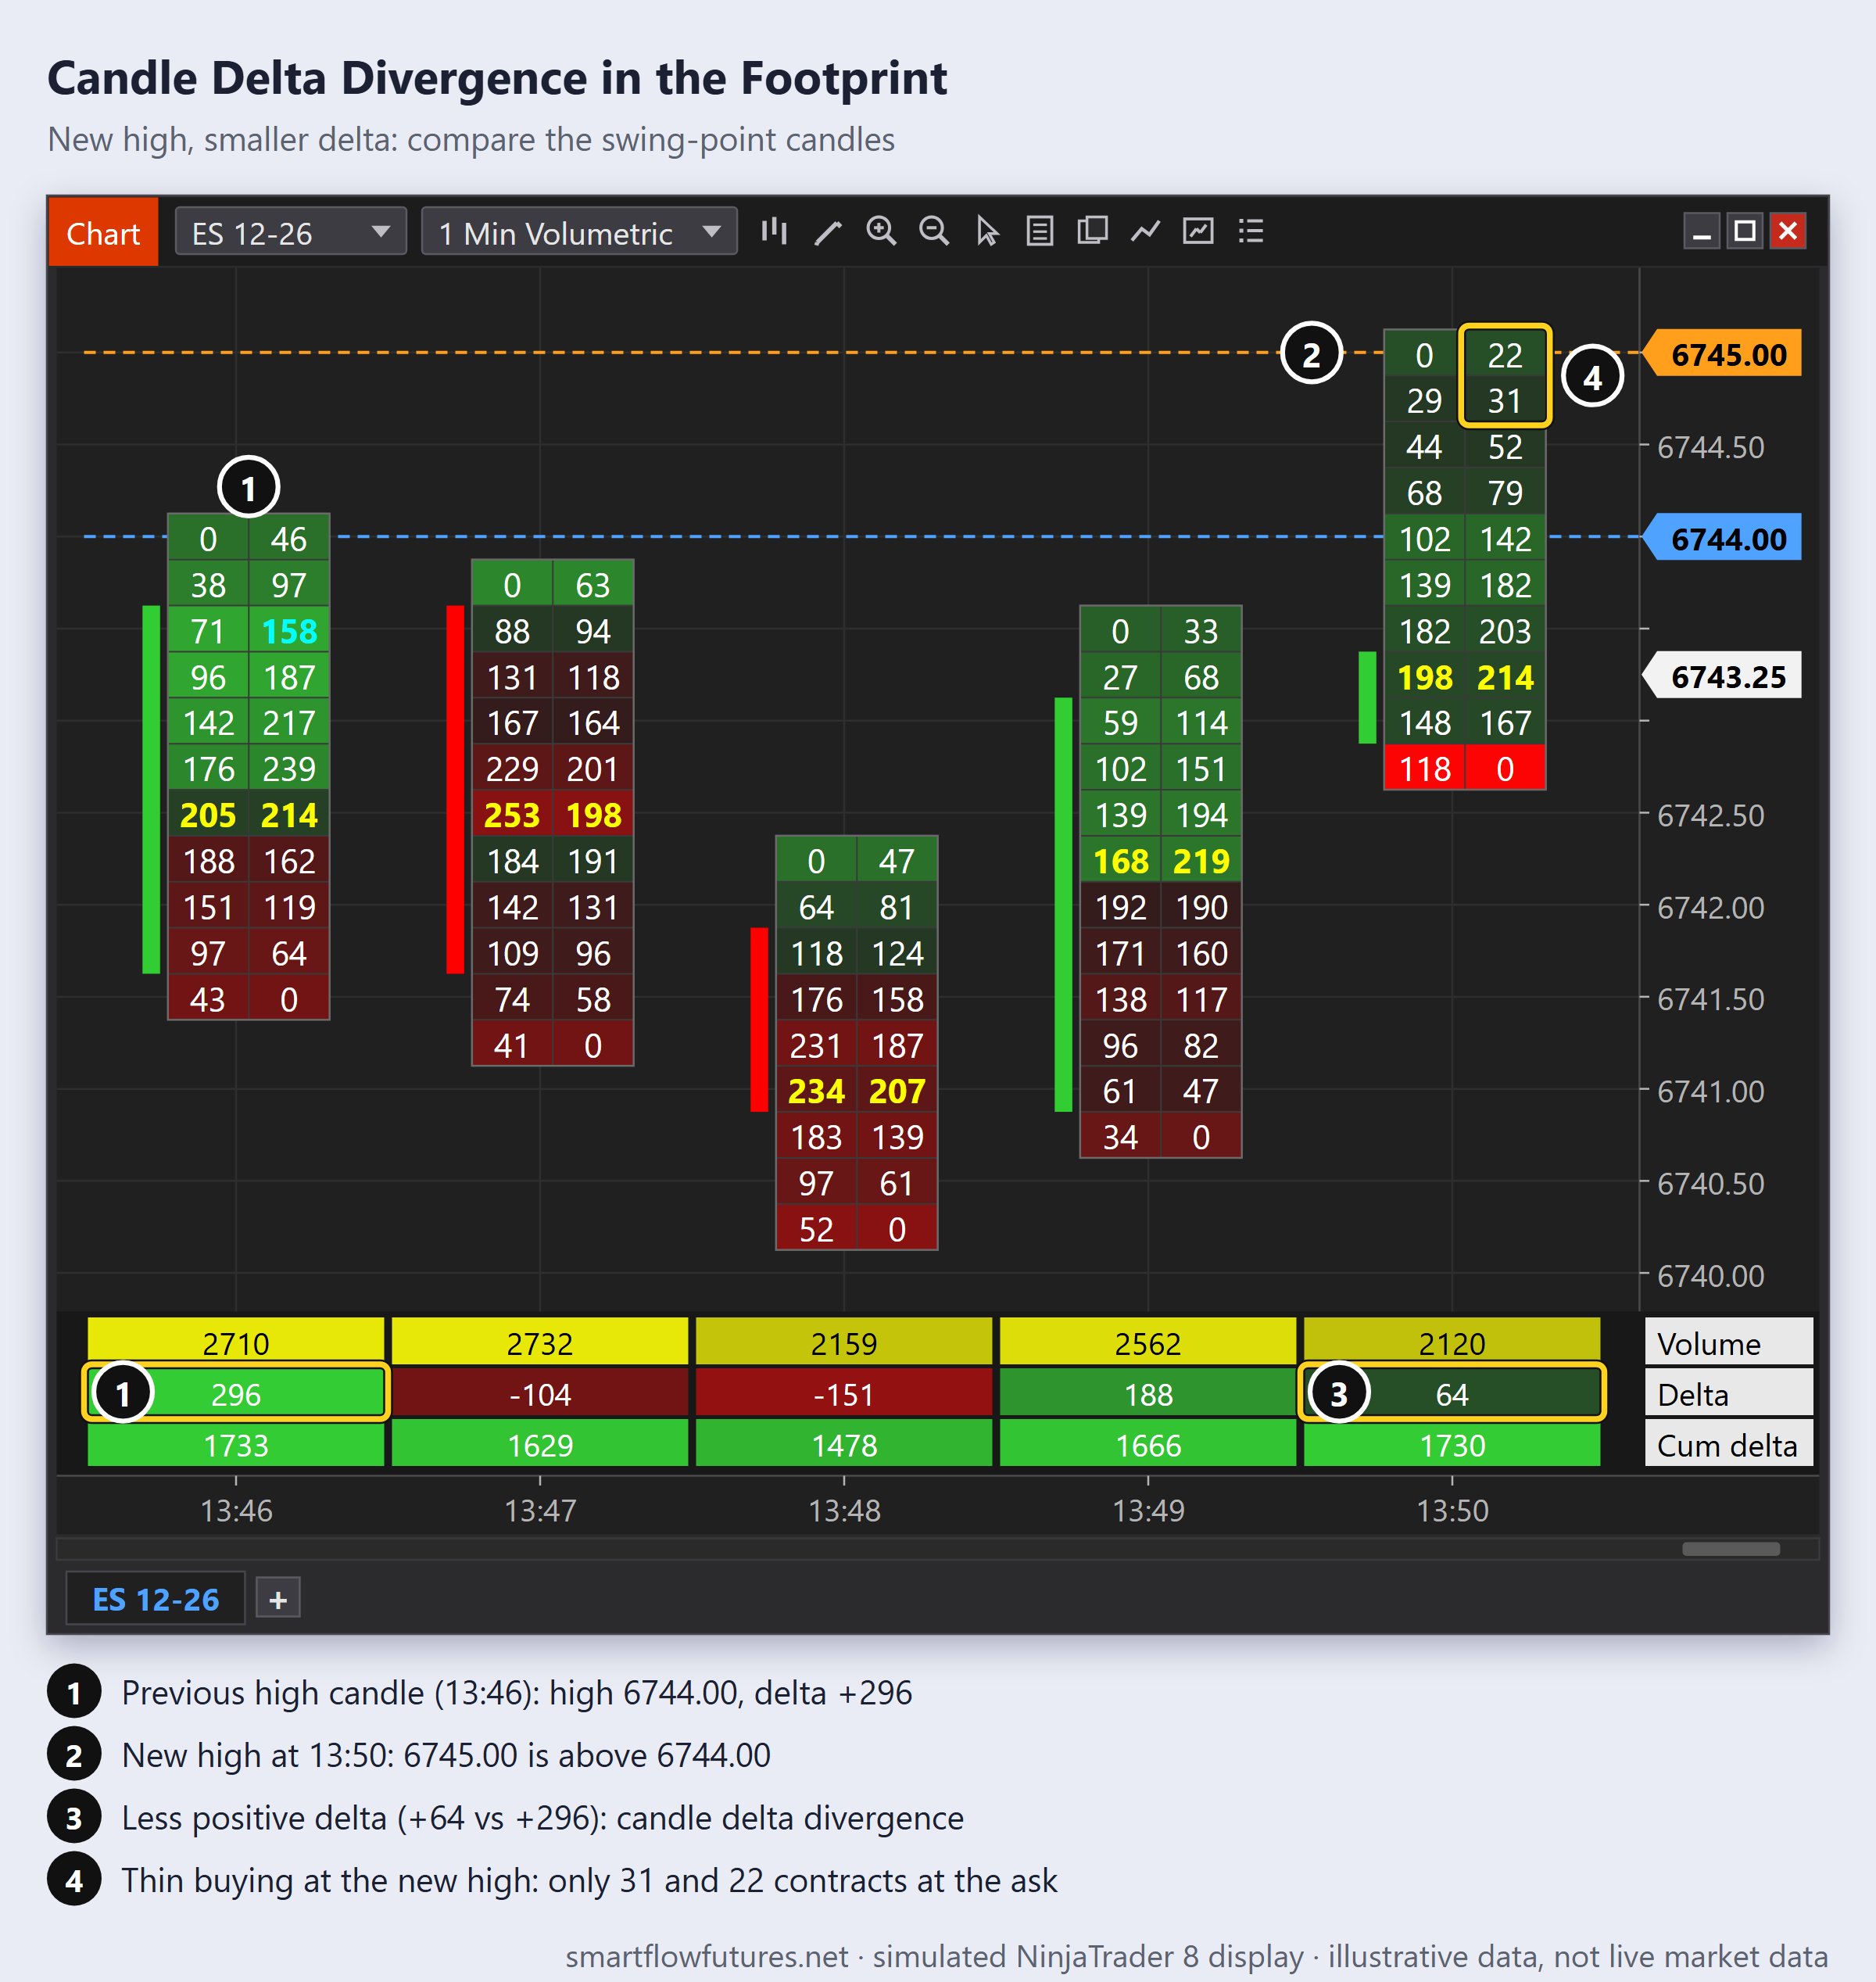
Cumulative Delta Divergence:
The most common form. Compare cumulative delta peaks and troughs with price peaks and troughs. This shows the big picture divergence over multiple swings.
Candle Delta Divergence:
Compare the delta of individual candles at swing points. If the candle making a new high has less positive delta than the previous high candle, divergence is present.
Real-Time Delta Divergence:
Watch delta during the formation of a candle. If price is pushing to new highs but delta is not expanding, divergence is developing in real-time.
Trading Bearish Divergence
The Setup:
Price makes a clear higher high. Check cumulative delta (or the delta of the candle at each high): is it also making a higher high? If it makes a lower high, bearish divergence exists.
The Trade:
Wait for confirmation: a rejection candle, lower timeframe CHOCH, or other reversal signal. Enter short with stop above the high. Target the previous swing low or SMC level below.
Best Conditions:
Divergence at resistance or a bearish order block. Divergence in premium zone. Divergence during NY or London session.
Trading Bullish Divergence
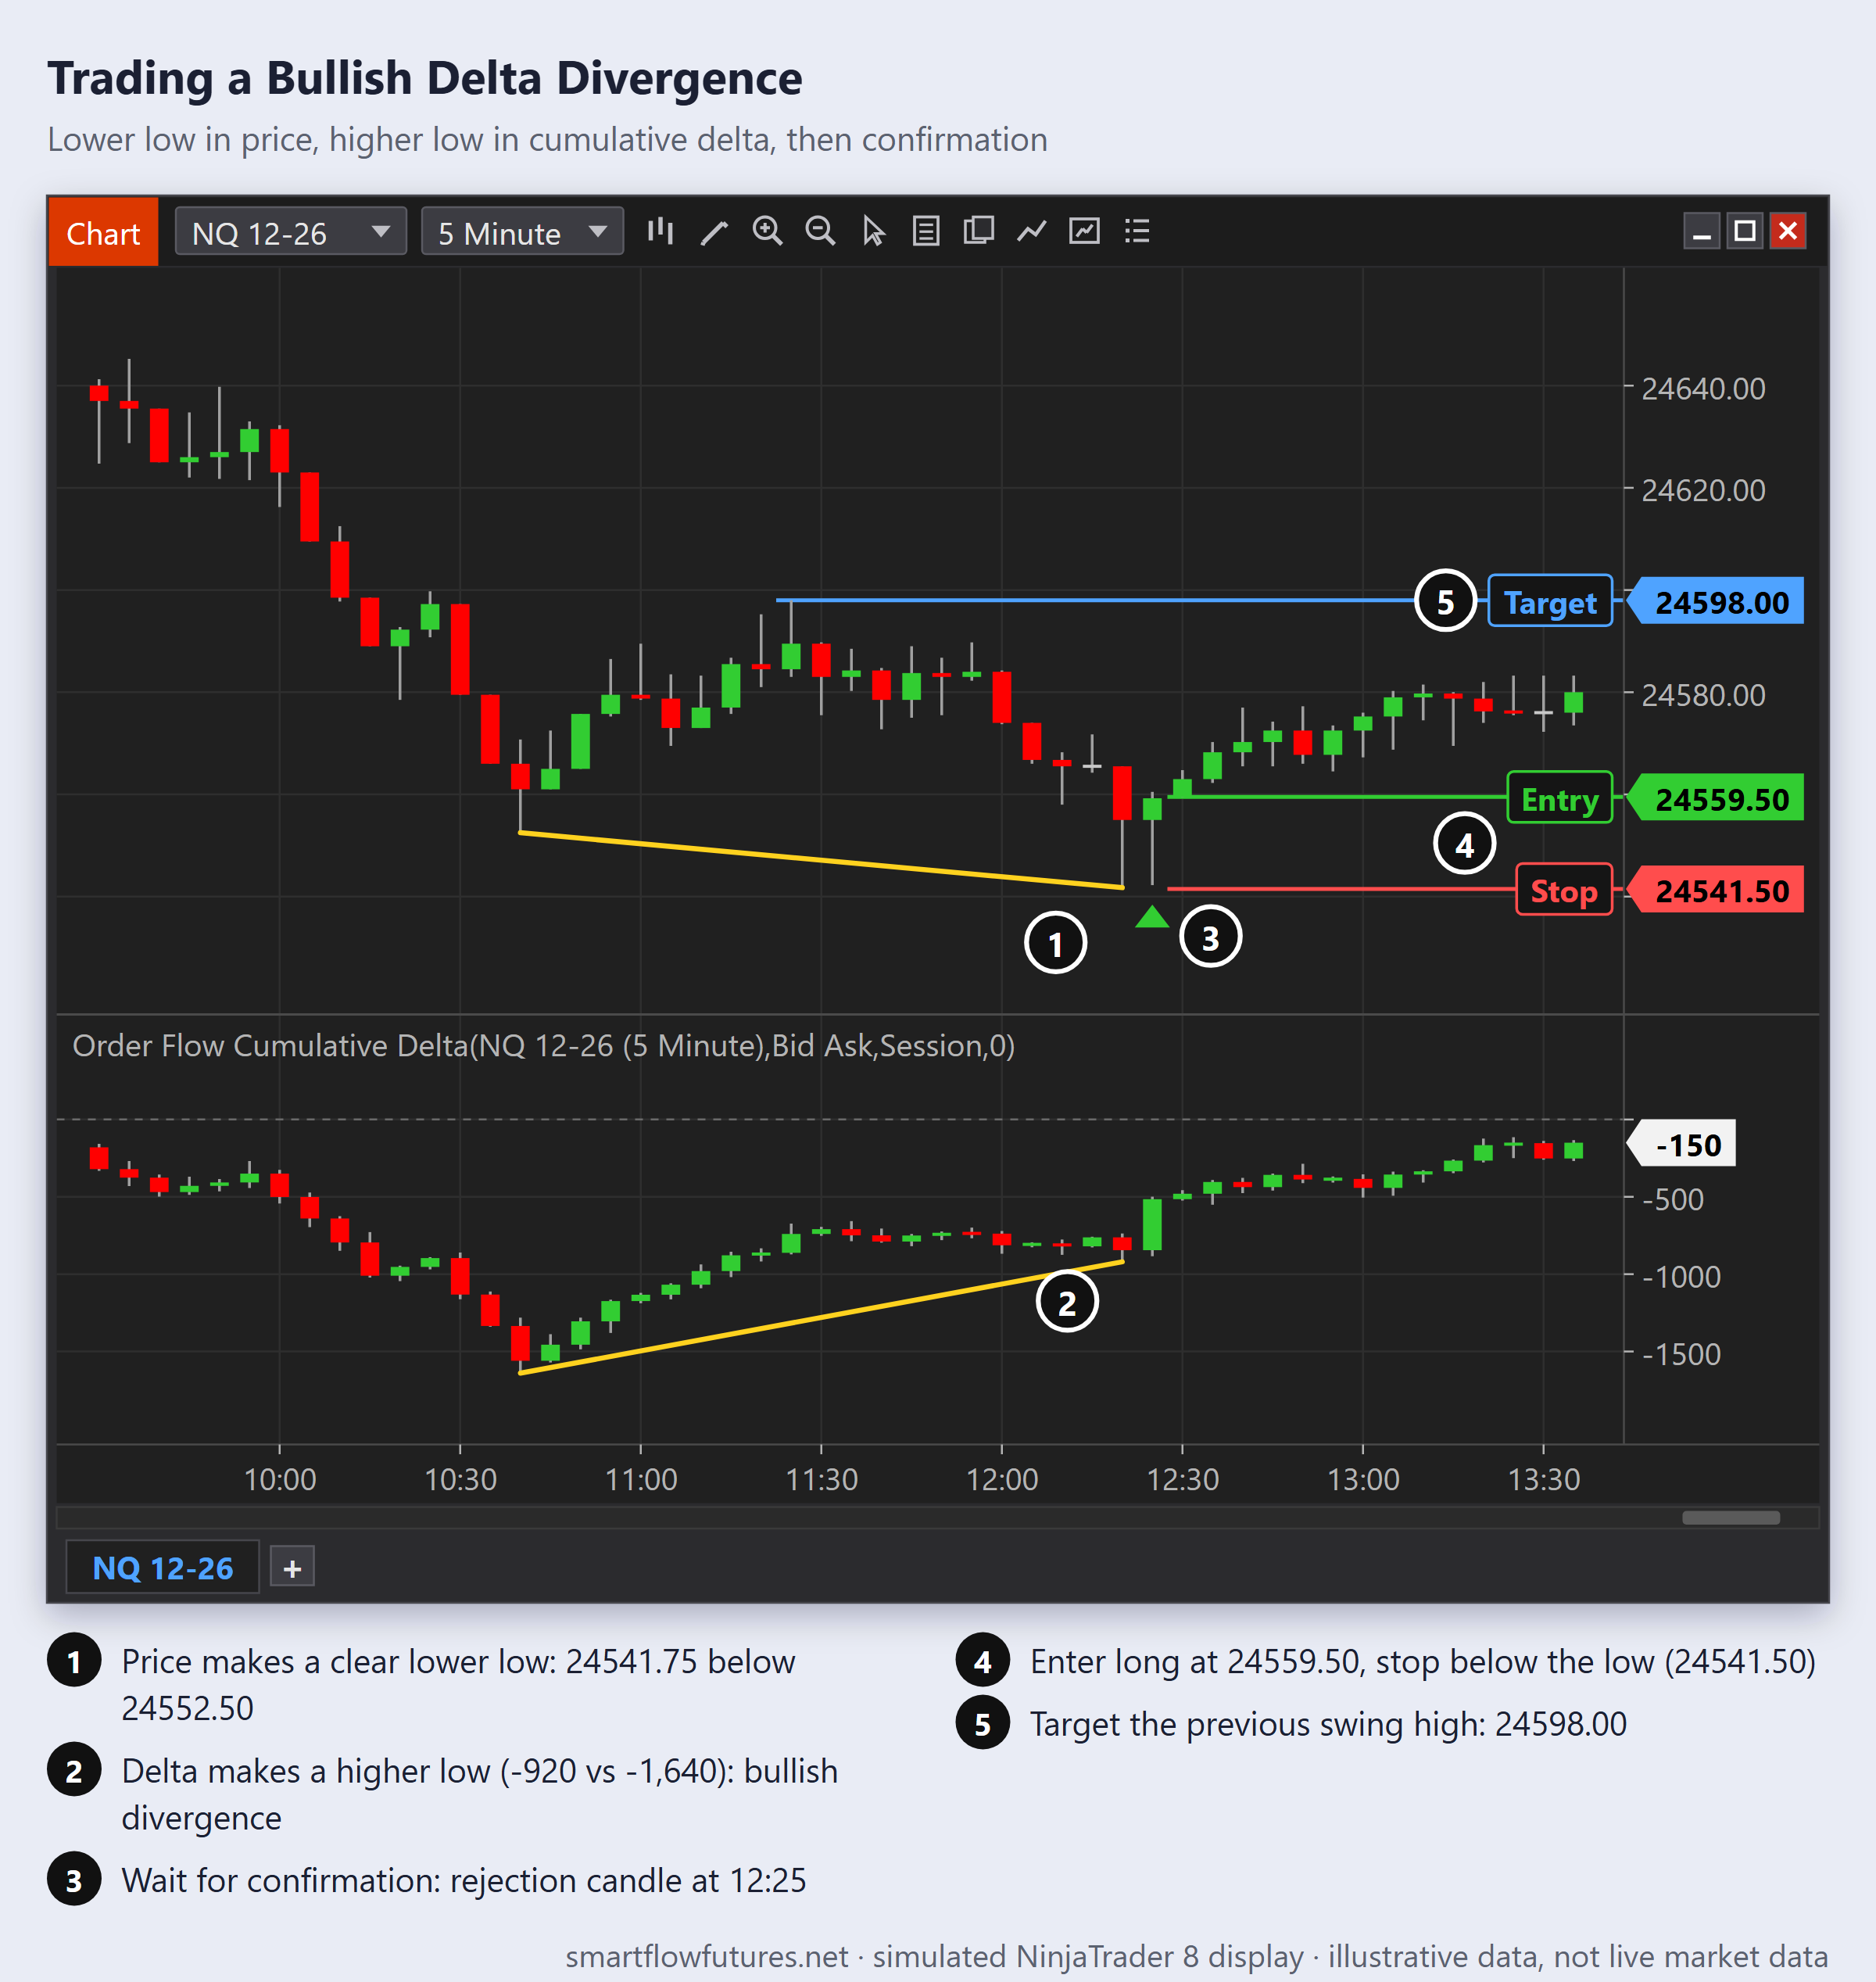
The Setup:
Price makes a clear lower low. Check cumulative delta (or the delta of the candle at each low): is it also making a lower low? If it makes a higher low, bullish divergence exists.
The Trade:
Wait for confirmation: a rejection candle, lower timeframe CHOCH, or other reversal signal. Enter long with stop below the low. Target the previous swing high or SMC level above.
Best Conditions:
Divergence at support or a bullish order block. Divergence in discount zone. Divergence during NY or London session.
Divergence with SMC Confluence
Divergence setups are stronger when they combine with SMC:
Divergence at Order Blocks:
Price reaches a bearish order block and makes a higher high. Delta shows bearish divergence. The order block is confirmed by Order Flow. A stronger short entry, taken after price action confirms the reversal.
Divergence at Liquidity:
Price sweeps liquidity (trades above a prior high, running the buy stops there, and the candle closes back below that high). Delta shows bearish divergence on the sweep: a lower delta high than at the high that was swept. The sweep was a trap, not a breakout. Enter short after the sweep with divergence confirmation.
Timeframes for Divergence
Divergence appears on all timeframes with varying significance:
Daily/4H Divergence: Most significant. Can precede multi-day or multi-week reversals. Use for swing trading and bias formation. When the two swings fall in different sessions, compare bar delta (Period: Bar) or a cumulative delta that runs across sessions: a Session-period cumulative delta resets every session.
1H/15M Divergence: Good for intraday trend changes. Suitable for day trading reversals.
5M/1M Divergence: Useful for entry timing within larger setups. Less significant on its own but valuable for refinement.
Higher timeframe divergences have more weight. A daily divergence at a weekly level is very significant.
Failed Divergences
Divergence is not a guarantee:
Divergence Can Persist: Price can continue making new highs despite bearish divergence for extended periods before reversing.
New Buyers Enter: Fresh institutional buying can restart the rally and negate the divergence.
Confirmation is Essential: Never enter solely on divergence. Wait for price action confirmation that the reversal is underway.
Practical Divergence Reading
Daily Routine:
At the start of each session, review the previous session’s cumulative delta against price structure (a Session-period cumulative delta resets at each session start). Are they aligned or diverging? Note any divergences at your key SMC levels. Use divergence as a filter for trade selection.
At Entry Points:
When considering a trade at an SMC level, check delta. Confirming delta (aligned with your direction) strengthens the trade. Divergent delta (against your direction) is a warning sign.
Key Takeaways
Delta divergence reveals hidden weakness or strength not visible in price. Bearish divergence: higher price high, lower delta high. Bullish divergence: lower price low, higher delta low. Combine divergence with SMC levels for stronger setups. Higher timeframe divergences are more significant. Always require price action confirmation before trading divergence.