
Iceberg orders, also called hidden orders, are a favorite tool of institutional traders. They allow large players to hide their true position size from the market, showing only a small “tip” while the bulk of the order remains hidden. Learning to detect icebergs reveals institutional activity that most traders miss.
What Are Iceberg Orders?
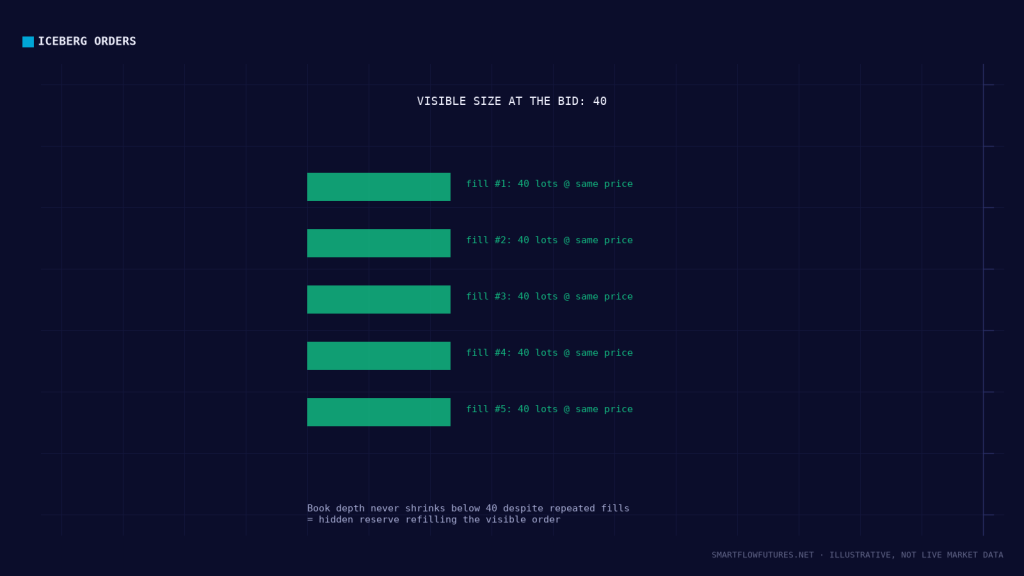
An iceberg order displays only a fraction of its total size to the market. When the visible portion is filled, it automatically refreshes with another portion from the hidden reserve. This continues until the entire order is executed.
Example:
An institution wants to buy 1,000 contracts but shows only 10. Each time the 10 contracts are filled, another 10 appear. This continues for 100 refreshes until all 1,000 are accumulated, without ever showing large size on the DOM.
Why Institutions Use Icebergs
Minimize Market Impact: Showing 1,000 contracts would move price against them. By hiding size, they get better average fills.
Avoid Tipping Intent: Large visible orders signal institutional interest. Other traders might front-run or trade against them.
Gradual Accumulation: Icebergs allow patient position building over time without revealing the full picture.
Detecting Iceberg Orders
On the DOM:
Small, consistent size that keeps refilling at the same price. The same quantity appears repeatedly after being filled. Unlike normal orders, the size never depletes fully.
On the Tape:
Repeated prints at the same price, same size. Example: 10@4500, 10@4500, 10@4500 appearing many times. Total volume at that price far exceeds what the DOM showed.
On Footprint Charts:
High volume at a single price level. Volume vastly exceeds what was visible on the DOM at that time. Often accompanied by absorption pattern characteristics.
Iceberg Indicators
Some platforms offer iceberg detection algorithms:
Refresh Detection: Algorithms that track when the same size reappears at a price level after being filled.
Hidden Volume Estimation: Tools that estimate total iceberg volume based on visible portion and refresh rate.
Iceberg Alerts: Notifications when iceberg activity is detected at a level.
These tools automate what experienced tape readers already do by hand. They track the pattern of refreshing orders.
Trading Iceberg Information
Icebergs as Support/Resistance:
A detected iceberg on the bid is hidden buying interest (potential support). A detected iceberg on the ask is hidden selling interest (potential resistance). These levels often hold better than levels without iceberg activity.
Icebergs and Absorption:
Iceberg orders often create absorption patterns. The hidden size absorbs aggressive orders, preventing price movement. Recognizing this as iceberg activity confirms institutional presence.
Icebergs with SMC:
When iceberg activity appears at your SMC levels (order blocks, FVGs), you have strong confirmation of institutional defense. This increases trade probability significantly.
Iceberg at Order Blocks
One of the highest-probability scenarios:
You identify an SMC order block. Price returns to test the level. As price taps the order block, you observe iceberg behavior (small size refreshing repeatedly). The institutional activity confirms the order block is being defended. Enter with confidence and manage accordingly.
Limitations of Iceberg Detection
Not Always Visible: Some iceberg algorithms are sophisticated and harder to detect. Very large orders may use multiple techniques to hide even better.
False Positives: Sometimes normal coincidental order flow looks like an iceberg. Confirmation with price action is important.
Timing: By the time you detect an iceberg, much of the order may already be filled. Detection helps with understanding the level, not always with entry timing.
Practical Iceberg Awareness
Integrate iceberg awareness into your trading:
At Key Levels: When price approaches significant SMC levels, pay extra attention to iceberg patterns.
During Absorption: If you see absorption, consider whether it might be iceberg-driven. The implications are the same, but understanding the mechanism helps.
For Confirmation: Use iceberg detection as another confirmation layer, not as a standalone strategy.
Tools for Iceberg Detection
Several platforms specialize in iceberg detection:
Bookmap: Known for excellent visualization of hidden orders and iceberg activity.
Jigsaw Trading: Offers tools specifically designed to detect iceberg behavior.
Sierra Chart: Has Order Flow tools that can be configured to highlight potential iceberg activity.
Each platform approaches detection differently. Explore options to find what fits your trading style.
Key Takeaways
Iceberg orders hide institutional size by showing only a small portion at a time. Detected through repeated same-size orders refilling at the same price. On tape, appears as many identical prints; on footprint, as unexpectedly high volume at a price. Iceberg activity at SMC levels confirms institutional presence and defense. Use iceberg detection as confirmation for your existing SMC analysis.