
Absorption is one of the most powerful Order Flow concepts. It occurs when aggressive market orders are absorbed by passive limit orders at a price level, preventing price from moving through. Absorption often signals institutional defense and precedes reversals.
Understanding Absorption
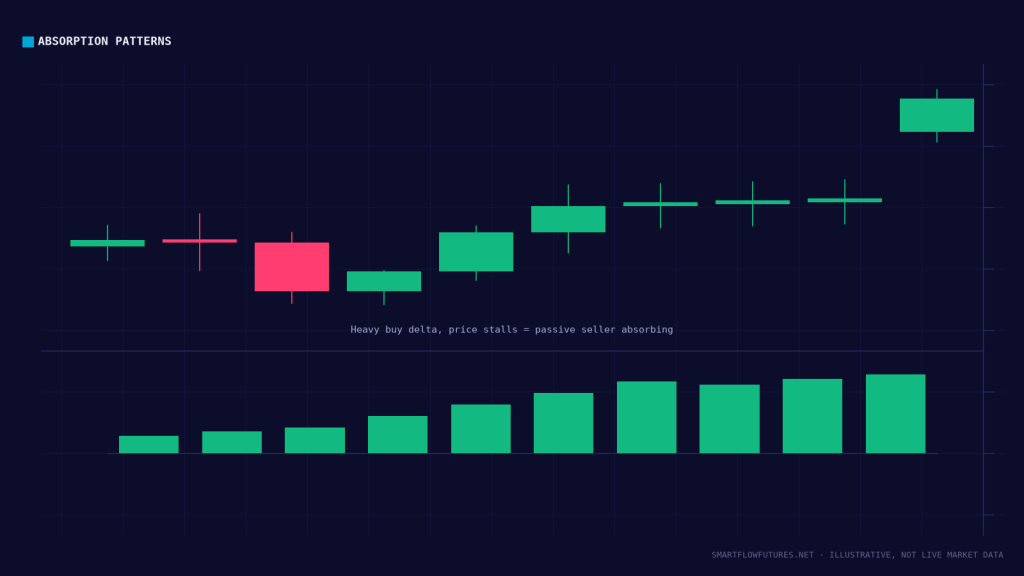
The Mechanics:
Market orders drive price movement by hitting resting limit orders. Normally, when aggressive orders consume available limit orders, price moves. Absorption occurs when limit orders are continuously refilled, absorbing the aggression without price breaking.
What It Reveals:
Someone (likely institutional) is defending a level. They have significant size to deploy. The aggressive side is hitting a wall. A reversal or stall is likely.
Types of Absorption
Bid Absorption (Support):
Aggressive sellers hitting the bid, but price not falling. Buyers are absorbing the selling pressure. Limit buy orders are being refilled as fast as they are hit. Bullish signal. Expect price to bounce.
Ask Absorption (Resistance):
Aggressive buyers hitting the ask, but price not rising. Sellers are absorbing the buying pressure. Limit sell orders are being refilled as fast as they are hit. Bearish signal. Expect price to reject.
Identifying Absorption
On the Tape:
High volume of prints at a level. Price not moving despite the volume. Same level printing repeatedly.
On the DOM:
Large orders at a level getting filled but reappearing. Size at the level remains constant or grows despite transactions.
On Footprint Charts:
High volume at the candle extreme (low for bids, high for asks). Price closing away from the absorption level. Delta may be neutral despite the volume if absorption is balancing aggression.
Absorption Patterns
Pattern 1: Failed Breakdown with Bid Absorption
Price breaks below a level. Heavy selling appears on the tape. Price cannot sustain the break. Bid absorption is evident. Price reverses back above the level. Often a powerful long signal.
Pattern 2: Failed Breakout with Ask Absorption
Price breaks above a level. Heavy buying appears on the tape. Price cannot sustain the break. Ask absorption is evident. Price reverses back below the level. Often a powerful short signal.
Pattern 3: Absorption at Order Block
Price retraces to an SMC order block. Absorption appears at the level (volume without price break). Price reverses from the order block. High-probability confirmation of institutional defense.
Absorption Quality Factors
Not all absorption is equal:
Volume: More volume absorbed means stronger defense. Minor absorption may not hold.
Duration: Longer absorption often means more committed defense. Quick absorption may just be a pause.
Level Significance: Absorption at significant SMC levels (order blocks, FVGs, liquidity) is more meaningful than at random prices.
Timeframe: Absorption visible on higher timeframes is more significant than micro-absorption on tick charts.
Trading Absorption
Entry on Absorption:
Identify a key SMC level. Watch for absorption as price tests the level. Enter in the reversal direction after absorption confirms. Place stops beyond the absorption zone.
Confirmation with Absorption:
You have an SMC setup ready. Wait for absorption at your level before entering. The absorption provides Order Flow confirmation of your SMC thesis.
Absorption vs. Distribution
Distinguish absorption from distribution:
Absorption: Defensive. One side absorbing aggression. Price fails to break. Reversal expected.
Distribution: Selling into demand (or buying into supply). Gradual transfer of positions. May appear similar but often precedes continuation in the original direction once distribution completes.
Context and follow-through help distinguish them. Absorption shows immediate price rejection; distribution may see gradual price drift.
Absorption with SMC Confluence
The most powerful setups combine absorption with SMC:
Absorption at Order Block: Confirms institutional defense of the level. High-probability reversal.
Absorption at Liquidity Sweep: Liquidity gets taken; then absorption appears as price reverses. Confirms the sweep was a trap.
Absorption at FVG: Price fills into an FVG, absorption appears, and price reverses. The imbalance zone is being defended.
Practical Absorption Reading
Develop your absorption recognition:
1. Watch Key Levels: Know your SMC levels before the session. Focus absorption reading at these levels.
2. Use Multiple Tools: Combine tape, DOM, and footprint readings. Absorption visible across multiple tools is more reliable.
3. Wait for Confirmation: Absorption is a signal, not an entry trigger alone. Wait for price to actually reverse before entering.
Key Takeaways
Absorption occurs when passive orders absorb aggressive orders without price moving. Bid absorption (at lows) is bullish; ask absorption (at highs) is bearish. Visible on tape as volume without price movement, on DOM as orders refilling, on footprint as volume at extremes. Best when combined with SMC levels (order blocks, FVGs, liquidity sweeps). Use absorption as confirmation for your SMC setups.