
Order flow imbalances occur when buying and selling activity are significantly unequal. These imbalances create directional pressure that often predicts short-term price movement. Learning to identify and trade imbalances adds a powerful tool to your Order Flow arsenal.
What is an Order Flow Imbalance?
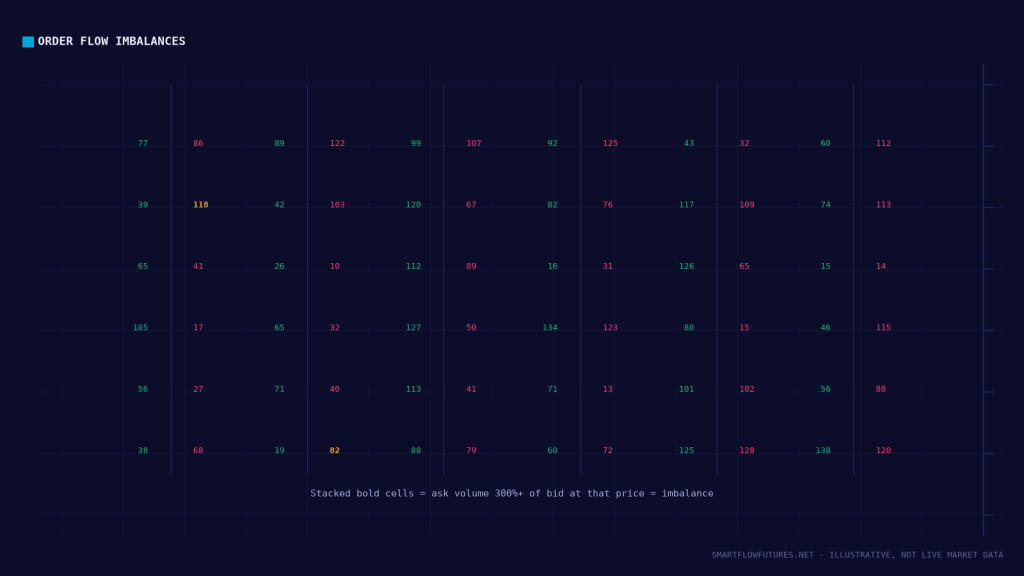
An imbalance exists when one side of the market is significantly more aggressive than the other:
Buying Imbalance: Significantly more volume trading at the ask (aggressive buyers) than at the bid (aggressive sellers).
Selling Imbalance: Significantly more volume trading at the bid (aggressive sellers) than at the ask (aggressive buyers).
Imbalances are typically measured as ratios. A 300% imbalance means one side has 3x the volume of the other.
Why Imbalances Matter
Imbalances reveal who is in control:
Supply and Demand: Significant buying imbalance means demand exceeds supply at current prices. Price typically rises to find more supply. Significant selling imbalance means supply exceeds demand. Price typically falls to find more demand.
Institutional Activity: Retail traders rarely create significant imbalances. Large imbalances often indicate institutional participation. The institution is aggressive and wants to move price.
Identifying Imbalances on Footprint
Footprint charts display imbalances visually:
Imbalance Highlighting: Most footprint tools highlight cells where imbalance exceeds a threshold. Green or blue highlighting for buying imbalances. Red or orange highlighting for selling imbalances.
Threshold Settings: Common thresholds are 200%, 300%, or 400%. Higher thresholds identify stronger imbalances. Lower thresholds show more activity but with more noise.
Start with 300% as a balanced threshold and adjust based on your observations.
Imbalance Patterns
Single Imbalance:
One price level showing imbalance. Least significant. Could be noise. Use for context, not as signal alone.
Stacked Imbalances:
Multiple consecutive price levels with same-sided imbalance. Highly significant. Shows institutional conviction. Often leads to continuation in imbalance direction.
Imbalance at Key Level:
Imbalance appearing at an SMC level (order block, FVG, liquidity). Confirms institutional interest at that level. Higher probability setup when combined with structure.
Trading Imbalances
With-Trend Imbalances:
In an uptrend, buying imbalances confirm continuation. In a downtrend, selling imbalances confirm continuation. These are higher probability. Trade with confidence.
Counter-Trend Imbalances:
Buying imbalance during a downtrend may signal reversal. Selling imbalance during an uptrend may signal reversal. Require more confirmation. Context matters most.
Entry Technique:
When stacked imbalances form in your direction: Consider immediate entry if already at valid setup. Or wait for pullback to the imbalance zone. Stop beyond the imbalance formation. Target based on structure and next significant level.
Imbalance Exhaustion
Watch for signs that imbalance is exhausting:
Diminishing Returns: Strong imbalance but price not moving proportionally. Each subsequent imbalance produces less movement. Suggests the move is running out of steam.
Absorption: Imbalance on one side being matched by passive orders on the other. Net effect is price stability despite aggressive activity. May precede reversal.
Imbalance and Delta
Imbalances and delta are related but different:
Delta: Net difference between buy and sell volume (at ask minus at bid). Shows overall pressure.
Imbalance: Ratio at specific price levels. Shows where institutional activity is concentrated.
Use both together: Delta for overall direction, imbalances for specific entry zones.
Practical Application
Scenario: Long Setup
Price retraces to bullish order block. As price enters the block, footprint shows stacked buying imbalances. Delta shifts positive. Entry: Long after imbalance confirmation. Stop: Below the order block. Target: Recent high and beyond.
Scenario: Reversal Confirmation
Price sweeps liquidity below support. Immediate stacked selling imbalances followed by stacked buying imbalances. Shift from sell to buy pressure confirms reversal. Entry: Long after imbalance shift. Stop: Below the sweep low.
Limitations
Time Sensitivity: Imbalances are most relevant in real-time or on recent bars. Old imbalances have less predictive value.
Context Required: Imbalances without context can mislead. A buying imbalance at strong resistance may fail. Always combine with structure and levels.
Threshold Sensitivity: Results vary based on threshold settings. Too low creates noise; too high misses signals. Calibrate for your market and timeframe.
Key Takeaways
Imbalances show when one side is significantly more aggressive. Buying imbalance suggests upward pressure; selling imbalance suggests downward pressure. Stacked imbalances indicate institutional conviction. With-trend imbalances confirm continuation; counter-trend may signal reversal. Use imbalances at SMC levels for high-probability setups. Combine with delta for complete Order Flow picture. Imbalances are most valuable in real-time at significant levels.