
The time and sales tape is the raw record of every trade that occurs, the market truth before any processing or aggregation. Advanced tape reading gives you real-time insight into market behavior that charts and indicators only show after the fact.
What is the Tape?
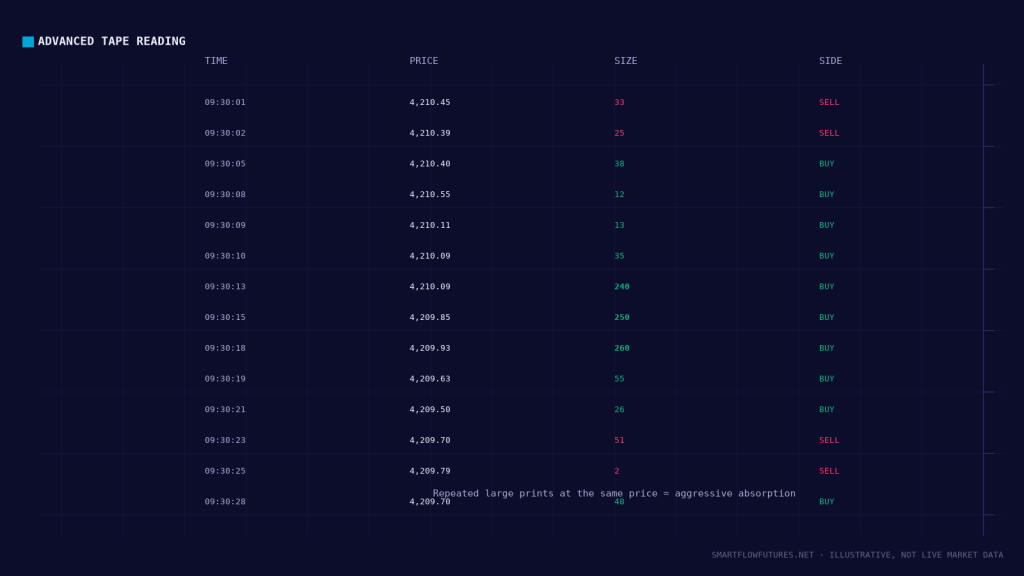
The time and sales (tape) displays every executed trade with:
Time: Exact timestamp of execution.
Price: Price at which the trade occurred.
Size: Number of contracts traded.
Aggressor: Whether the trade was initiated by a buyer (at ask) or seller (at bid).
The tape shows what actually happened, not what might happen (order book).
Reading Trade Aggression
Each trade is initiated by either a buyer or seller:
Trades at Ask: A buyer used a market order or lifting an offer. Represents aggressive buying. Typically highlighted in green.
Trades at Bid: A seller used a market order or hitting a bid. Represents aggressive selling. Typically highlighted in red.
The balance of aggressive buying versus selling reveals who is in control.
Significant Tape Patterns
Large Prints:
Single trades much larger than average size. Indicates institutional activity. Context matters. A large print at support after a decline may indicate buying. A large print at resistance after a rally may indicate selling.
Print Clusters:
Rapid succession of trades in one direction. Shows urgency and conviction. More significant than the same volume spread over time.
Absorption Prints:
Heavy aggressive activity on one side without price movement. Visible as continuous prints at the same price. Indicates passive orders absorbing aggression.
Speed and Rhythm
The tempo of the tape conveys information:
Fast Tape: Rapid prints indicate high activity, often during breakouts, reversals, or news. Requires quick interpretation.
Slow Tape: Sporadic prints indicate low interest, a waiting mode where the market is searching for direction. Often during consolidation or off-hours.
Rhythm Changes: Sudden acceleration after quiet period often precedes moves. Deceleration after fast tape may signal exhaustion.
Filtering the Tape
Raw tape can be overwhelming. Filtering helps:
Size Filter: Only show trades above a certain size. Focuses on significant activity. Filters out noise from small traders.
Aggressor Filter: Show only buys or only sells. Useful when looking for specific activity.
Price Filter: Only show trades at certain price levels. Useful for monitoring the levels that matter to your setup.
Experiment with filters to find what works for your trading style.
Tape Reading at Key Levels
The tape is most valuable at significant price levels:
At Support: Watch for aggressive buying appearing. Large prints on the bid absorbed without breaking. Selling attempts failing to produce continuation.
At Resistance: Watch for aggressive selling appearing. Large prints on the ask absorbed without breaking. Buying attempts failing to produce continuation.
At Order Blocks: Tape confirms whether the block is being defended. Look for absorption patterns at the block level.
Interpreting Large Prints
When you see an unusually large trade:
Context Questions: Where in the price structure did it occur? Was it at a significant level? What was the aggressor direction? Did price react to it?
Possible Meanings:
Large buy at support: Institutional buying, bullish. Large buy at resistance: Possible distribution, watch reaction. Large sell at resistance: Institutional selling, bearish. Large sell at support: Possible capitulation or breakdown.
Single prints are not signals. They are context for analysis.
Tape and Entry Timing
Use tape for entry timing within your setup:
Entry Confirmation: When your setup triggers, watch the tape. Aggressive activity in your direction confirms. Lack of activity or contrary activity suggests waiting.
During Entries: Monitor tape as you enter. Is your direction being supported? If tape shows strong contrary flow, consider reducing size.
For Exits: Tape can signal deterioration before price shows it. Aggressive contrary flow appearing suggests taking profits.
Developing Tape Reading Skills
Practice Required: Tape reading is a skill developed over time. Watch the tape during active sessions even when not trading. Notice patterns and what follows them.
Focus on One Market: Each market has its own tape personality. Learn the normal rhythm before identifying abnormal activity.
Correlate with Price: Always watch tape alongside price action. Understanding what tape patterns precede price moves is the goal.
Key Takeaways
The tape shows every executed trade with time, price, size, and aggressor. Trade aggressor (at bid vs at ask) shows who is initiating. Large prints and print clusters indicate significant activity. Tape speed and rhythm convey market energy. Filter tape to focus on significant activity. Most valuable at support, resistance, and order block levels. Tape reading is a skill requiring practice to develop.