
Tape reading is one of the oldest trading skills, dating back to when stock prices were transmitted via ticker tape. Today, the Time and Sales window serves the same purpose: showing every executed transaction in real-time.
What is the Tape?
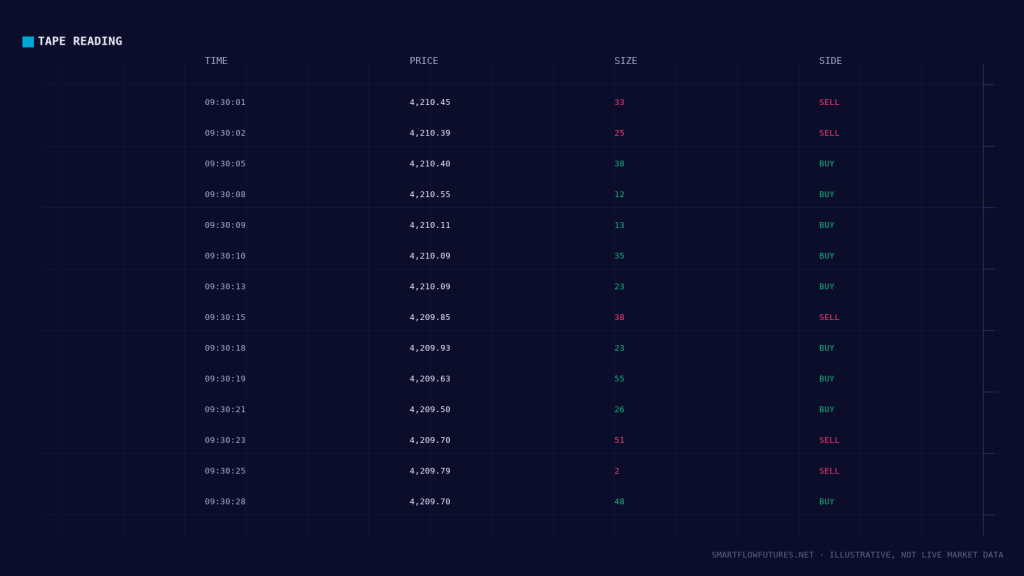
The Time and Sales (T&S) window, commonly called “the tape,” displays a running list of executed trades. Each line shows: the time of the transaction, the price at which it occurred, the size (number of contracts or shares), and often whether it was executed at the bid or ask.
While the DOM shows pending orders, the tape shows completed transactions. This tells you what is actually happening, not just what traders intend.
Reading the Tape
Transaction Flow:
Watch the speed of transactions. Fast scrolling indicates high activity. Slow, sporadic prints indicate low activity. Sudden bursts of activity often precede moves.
Print Size:
Most prints are small (1-5 contracts in futures). Medium prints (10-50 contracts) show larger interest. Large prints (100+ contracts) often represent institutional activity.
Print Color/Side:
Trades executed at the ask are typically colored differently (often green or blue). Trades executed at the bid are often red. This shows which side initiated the transaction.
Tape Patterns
Aggressive Buying:
Multiple consecutive prints at the ask. Price lifting through levels. Large prints appearing at the ask. Tape scrolling faster with ask-side dominance.
Aggressive Selling:
Multiple consecutive prints at the bid. Price falling through levels. Large prints appearing at the bid. Tape scrolling faster with bid-side dominance.
Absorption:
Large prints on one side but price not moving. Suggests the opposite side is absorbing the aggression. Example: Many sells at the bid, but price holds—buyers are absorbing.
Exhaustion:
Aggressive prints slow down after a move. Size diminishes. The move may be ending.
Large Print Significance
Large prints (block trades) deserve special attention:
On Breakouts: Large prints supporting a breakout direction suggest institutional participation. More likely to follow through.
At Levels: Large prints at your SMC levels (order blocks, FVGs) confirm activity at those zones.
Against Direction: Large prints opposing the current move may signal reversal. Institutions positioning for a turn.
Tape Reading Challenges
Speed: In active markets, the tape scrolls faster than you can read. Focus on patterns rather than individual prints.
Noise: Many small prints are just noise. Filter for significant activity.
Modern Markets: High-frequency trading creates tape activity that may not reflect human decision-making.
Tape with SMC
Integrate tape reading with your SMC analysis:
At Order Blocks: When price reaches your order block, watch the tape. Are large prints appearing supporting your direction? Is absorption occurring?
During Liquidity Sweeps: Watch the tape during a sweep. Large prints often appear as stops trigger. The direction of prints after the sweep indicates likely continuation.
For Entry Timing: Use tape confirmation for your entries. Wait for prints supporting your direction before executing.
Practical Tape Usage
For most traders, tape reading works best for:
Entry Confirmation: When at your level, watch for supporting tape activity before entering.
Exit Signals: If tape activity turns against your position at a key level, consider exiting.
Market Context: General tape observation helps understand current market activity levels.
Setting Up Time and Sales
Configure your T&S window for usability:
Filter out very small prints if desired (though this has trade-offs). Use clear color coding for bid vs. ask prints. Position the window where you can see it without cluttering your chart view. Consider audio alerts for large prints if your platform supports it.
Developing Tape Skills
Tape reading is a skill that develops over time:
1. Observe Without Trading: Spend time just watching the tape during active sessions. Notice patterns during moves.
2. Correlate with Price: Watch the tape while also watching price. Connect tape activity to price movement.
3. Identify Your Tells: Over time, you will notice specific tape patterns that precede moves in your market. These become your personal signals.
Key Takeaways
The tape (Time and Sales) shows every executed transaction in real-time. Watch for print size, side (bid or ask), and pace of activity. Aggressive activity shows consecutive prints on one side with price movement. Absorption shows prints on one side without price movement. Use tape reading to confirm SMC setups and time entries.