
Cumulative Delta: Tracking Market Sentiment
Learn how to use cumulative delta to measure buying versus selling pressure over time and identify institutional activity.
While single-bar delta shows buying versus selling pressure for individual candles, cumulative delta reveals the bigger picture by tracking the running total of delta over time. This powerful tool helps traders identify when institutions are accumulating or distributing positions, often before price reflects this activity. Understanding cumulative delta is essential for confirming SMC setups with order flow evidence.
What is Cumulative Delta?
Definition
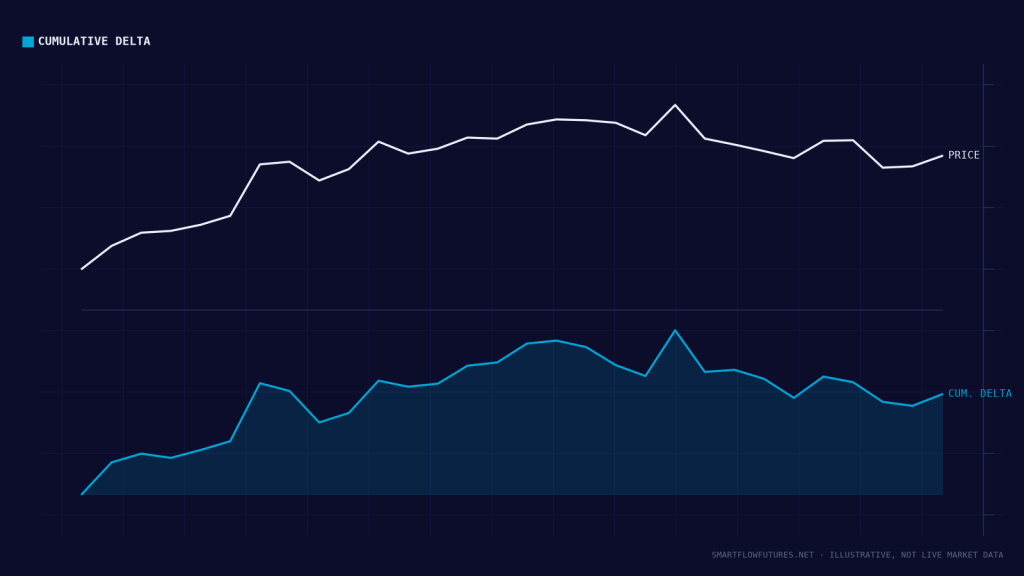
Cumulative delta is the running sum of delta values over a specified period. Each bar delta (buying volume minus selling volume at the bid/ask) is added to the previous total, creating a line that rises when buyers dominate and falls when sellers dominate.
Rising Cumulative Delta
- Net buying pressure over time
- Aggressive buyers lifting offers
- Bullish institutional activity
- Accumulation phase indicator
Falling Cumulative Delta
- Net selling pressure over time
- Aggressive sellers hitting bids
- Bearish institutional activity
- Distribution phase indicator
Cumulative Delta and Price Relationship
| Price Action | Cumulative Delta | Interpretation | Trading Implication |
|---|---|---|---|
| Price Rising | Delta Rising | Confirmed Uptrend | Trend is healthy, look for longs |
| Price Rising | Delta Falling | Bearish Divergence | Weakness, potential reversal |
| Price Falling | Delta Falling | Confirmed Downtrend | Trend is healthy, look for shorts |
| Price Falling | Delta Rising | Bullish Divergence | Accumulation, potential reversal |
| Price Flat | Delta Rising | Hidden Accumulation | Breakout likely upward |
| Price Flat | Delta Falling | Hidden Distribution | Breakdown likely downward |
Cumulative Delta Divergences
Bullish Divergence
Price makes lower lows while cumulative delta makes higher lows. This indicates that despite falling prices, buying pressure is increasing. Sellers are becoming exhausted and buyers are quietly accumulating. This often precedes significant reversals to the upside.
Bearish Divergence
Price makes higher highs while cumulative delta makes lower highs. This shows that despite rising prices, selling pressure is increasing. Buyers are becoming exhausted and sellers are quietly distributing. This often precedes significant reversals to the downside.
The best divergences occur at specific SMC levels such as order blocks, liquidity sweeps, or premium/discount zones. A divergence at a random price level is less significant than one occurring at a known institutional reference point.
Practical Applications
Application 1
Application 2
Application 3
Application 4
Reading the Cumulative Delta Line
- Slope matters more than absolute value: Focus on whether cumulative delta is rising, falling, or flat rather than the specific number.
- Look for changes in slope: When cumulative delta changes from falling to rising (or vice versa), pay attention. This signals a shift in institutional activity.
- Compare to price structure: Always analyze cumulative delta relative to price. The relationship between the two provides the insight.
- Use appropriate timeframes: Session-based cumulative delta (reset at session start) can be more useful than continuous cumulative delta for day trading.
- Watch for acceleration: Steep moves in cumulative delta indicate strong conviction. Gradual changes suggest cautious positioning.
Platform Setup Tips
| Setting | Recommendation | Reason |
|---|---|---|
| Reset Period | Session or Daily | Cleaner reading for day traders |
| Display Type | Line Chart | Easier to see trends and divergences |
| Smoothing | None or Minimal | Preserve accuracy of data |
| Position | Separate Panel | Do not overlay on price chart |
Sierra Chart, ATAS, Bookmap, and Quantower all offer excellent cumulative delta visualization. Most platforms allow customization of reset periods and display styles.
Cumulative delta reveals the story behind price action by showing net buying or selling pressure over time. Use it to confirm SMC setups, identify divergences at SMC levels, and validate that institutional activity supports your trade thesis. Remember: healthy trends show price and cumulative delta moving together, while divergences warn of potential reversals.