
Auction Market Theory (AMT) provides a framework for understanding how markets function as two-sided auctions. It explains how price discovers fair value and what happens when markets are balanced versus imbalanced. This theory underlies much of what we observe in Order Flow and Market Profile.
The Market as Auction
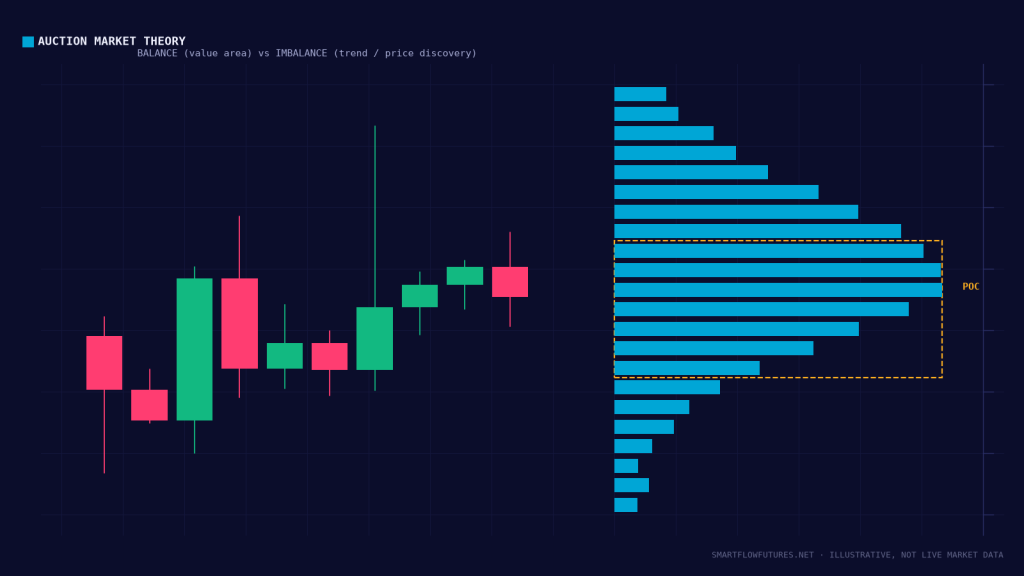
Markets are continuous two-way auctions:
Purpose: The market auction process discovers the price at which buyers and sellers agree to transact. This price reflects current perceptions of fair value.
Mechanism: Price rises when buyers outnumber sellers, auctioning up until sellers step in. It falls when sellers outnumber buyers, auctioning down until buyers step in. When buying and selling are balanced, price oscillates in a range.
Value Area Concept
Value is not a single price but a range where most trading occurs:
Value Area: The price range containing approximately 70% of trading activity. Represents where market participants agree on fair value. Typically calculated from Market Profile or Volume Profile.
Value Area High (VAH): The upper boundary of the value area. Often acts as resistance when price is outside value.
Value Area Low (VAL): The lower boundary of the value area. Often acts as support when price is outside value.
Point of Control (POC): The price level with the most trading activity. The single price level of highest acceptance. Strong reference point.
Balance and Imbalance
Balanced Market:
Buying and selling are roughly equal. Price rotates within a range. Market Profile shows a bell curve distribution. Trading strategy: Mean reversion, buy at value low, sell at value high.
Imbalanced Market:
One side dominates (buyers or sellers). Price trends directionally. Market Profile shows elongated or skewed distribution. Trading strategy: Trend following, trade with the imbalance.
Most trading days show periods of both balance and imbalance.
Auction Rotations
Markets move through auction rotations:
Up Auction: Price rises to find sellers. Continues until sellers emerge in sufficient quantity. Often ends at prior highs, resistance, or when buyers exhaust.
Down Auction: Price falls to find buyers. Continues until buyers emerge in sufficient quantity. Often ends at prior lows, support, or when sellers exhaust.
Understanding which auction is active helps determine trade direction.
Single Prints and Excess
Single Prints:
TPO (Time Price Opportunity) or volume levels where activity is very low. Indicates price moved quickly through this area. Market rejected these prices rapidly.
Excess:
Single prints at extreme highs or lows show auction rejection. The market strongly rejected higher or lower prices. Creates reference points for future trading. Often acts as support or resistance when retested.
Poor Highs and Lows
Poor High:
A high that lacks excess (no strong rejection). Flat or blunt appearance on profile. Suggests sellers did not aggressively reject higher prices. May indicate unfinished business. Price likely to return and test higher.
Poor Low:
A low that lacks excess. Flat or blunt appearance on profile. Suggests buyers did not aggressively reject lower prices. May indicate unfinished business. Price likely to return and test lower.
Poor highs and lows are magnets for future price action.
Value Acceptance and Rejection
Opening Relative to Value:
Opening above value area: Bullish bias if accepted. Opening below value area: Bearish bias if accepted. Opening inside value area: Neutral, watch for directional development.
Acceptance vs Rejection:
Acceptance: Price enters an area and stays, building volume. Market agrees this is fair value. Rejection: Price enters an area and quickly exits. Market does not agree this is fair value.
AMT and Trading Decisions
Inside Value Area: Expect mean reversion toward POC. Fade extremes unless structure breaks.
Outside Value Area (Above): If accepted (building volume above VAH): Bullish, new value forming. If rejected (quick return below VAH): Bearish, failed breakout.
Outside Value Area (Below): If accepted (building volume below VAL): Bearish, new value forming. If rejected (quick return above VAL): Bullish, failed breakdown.
Integrating AMT with SMC
AMT and SMC complement each other:
Order Blocks at Value Extremes: OBs at VAH or VAL gain significance. These levels have both institutional interest and auction significance.
Liquidity and Poor Structure: Poor highs and lows often have liquidity above or below. The market may sweep this liquidity before reversing.
FVGs and Single Prints: FVGs often form in single print areas. Price moved quickly, leaving imbalance.
Key Takeaways
Markets function as continuous two-sided auctions discovering fair value. Value area contains 70% of activity; POC is the highest-volume price. Balanced markets oscillate in range; imbalanced markets trend. Single prints and excess show strong auction rejection. Poor highs and lows lack rejection and invite retest. Price acceptance or rejection of value areas guides trading bias. AMT concepts enhance SMC analysis at key levels.