
POC and Value Area: Where Price Finds Balance
Master volume profile concepts to identify areas of price acceptance and rejection for high-probability trade locations.
Volume Profile transforms how you view the market by showing where trading activity actually occurred, not just when. The Point of Control (POC) and Value Area are core concepts that reveal fair value, areas of acceptance, and zones where price is likely to react. Understanding these concepts helps you identify institutional reference points that complement your SMC analysis.
Point of Control (POC)
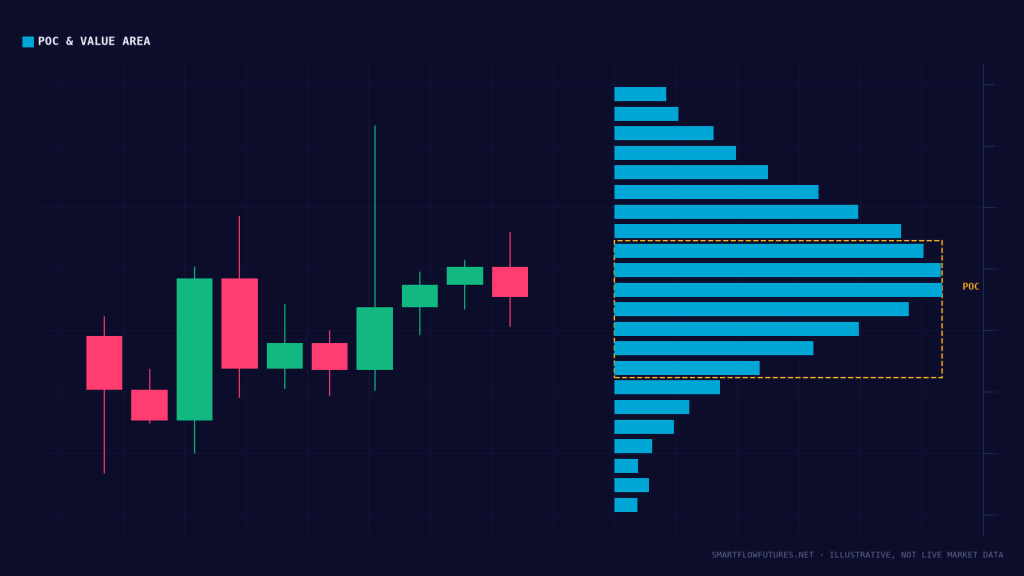
Definition
The Point of Control is the price level with the highest traded volume over a specified period. It represents the fair value price where the most agreement between buyers and sellers occurred. The POC acts as a magnet for price and often becomes support or resistance.
POC as Support
- Price trading above POC finds support there
- Previous session POC acts as reference
- Multiple POCs at same level strengthen zone
- Buyers previously showed interest here
POC as Resistance
- Price trading below POC finds resistance there
- Failed auctions above POC signal weakness
- Naked POCs (untested) are magnets
- Sellers previously defended this level
A naked POC is a previous session POC that price has not returned to test. These levels act as strong magnets and price often returns to fill them, similar to unfilled fair value gaps in SMC.
Value Area Explained
What is the Value Area?
The Value Area represents the price range where 70% of trading volume occurred. It defines the zone of price acceptance where most market participants agreed on value. The Value Area has two boundaries: Value Area High (VAH) and Value Area Low (VAL).
| Component | Definition | Trading Use |
|---|---|---|
| Value Area High (VAH) | Upper boundary of 70% volume zone | Resistance when approaching from below |
| Value Area Low (VAL) | Lower boundary of 70% volume zone | Support when approaching from above |
| Point of Control (POC) | Highest volume price within VA | Fair value, magnet for price |
| High Volume Nodes (HVN) | Secondary volume peaks | Additional support/resistance |
| Low Volume Nodes (LVN) | Volume valleys | Price moves quickly through these |
Value Area Trading Strategies
Strategy 1
Strategy 2
Strategy 3
Strategy 4
Combining POC/VA with SMC
Order Block + POC Confluence
When an order block aligns with a previous session POC, the level gains significant importance. The OB shows where institutions entered, and the POC confirms high volume activity at that price. This confluence creates high-probability reaction zones.
FVG + Low Volume Node
Fair value gaps often correspond to low volume nodes on the volume profile. Both concepts identify areas where price moved quickly with little trading. When an FVG aligns with an LVN, expect price to move rapidly through when it returns to fill.
Liquidity + Value Area Boundary
Liquidity pools often form at VAH and VAL because stop losses cluster around these obvious levels. A sweep of VAH that fails to hold above becomes a distribution event. A sweep of VAL that fails to hold below becomes an accumulation event.
Use volume profile to validate SMC levels. An order block with no significant volume profile presence may be less reliable than one that corresponds to a high volume node or POC.
Volume Profile Timeframes
| Profile Type | Use Case | Best For |
|---|---|---|
| Session Profile | Previous day VA/POC | Day trading references |
| Weekly Profile | Week-to-date value | Swing trading context |
| Monthly Profile | Longer-term fair value | Position trading |
| Fixed Range | Custom date range | Analyzing specific moves |
| Visible Range | What is on screen | Quick reference |
Daily Preparation Workflow
Identify previous session POC, VAH, VAL and any naked POCs from earlier sessions.
Determine if price opens inside or outside previous value area and above or below POC.
Look for areas where POC/VA levels align with SMC concepts like order blocks or liquidity.
Determine your bias based on value area relationship and plan entries at high-probability levels.
POC and Value Area reveal where the market finds fair value and where price is accepted or rejected. Use POC as a magnet and a support/resistance level. Trade value area boundaries for mean reversion or breakout plays. Combine these levels with SMC concepts for confluence-based high-probability setups.