
Delta is one of the most important Order Flow metrics. By calculating the difference between buying volume and selling volume, delta quantifies which side is more aggressive. This simple calculation provides powerful insights into market dynamics.
Understanding Delta
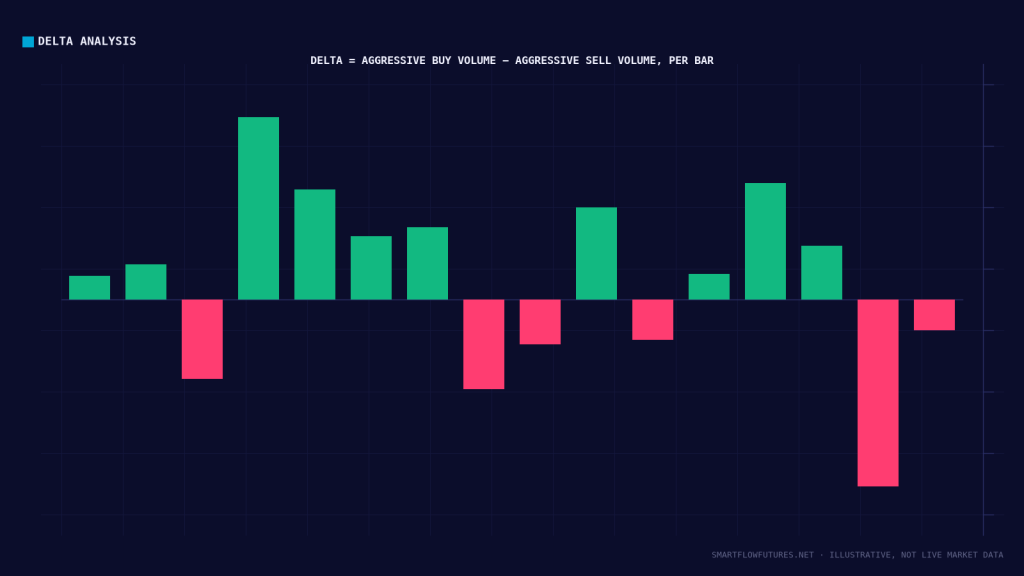
The Calculation:
Delta = Volume at Ask – Volume at Bid. Positive delta means more volume was transacted at the ask (buying aggression). Negative delta means more volume was transacted at the bid (selling aggression).
Why It Matters:
Price can move up with either buying aggression or lack of selling. Price can move down with either selling aggression or lack of buying. Delta tells you which is occurring. That context isn’t available from price alone.
Types of Delta Analysis
Candle Delta:
The total delta for a single candle. Shows which side won that time period. Easy to read but lacks granularity.
Cumulative Delta:
Running total of delta over time. Shows the trend of aggression over sessions. Useful for identifying divergences.
Delta at Price:
Delta calculated for each price level (as seen in footprint charts). Shows where within a move buyers or sellers dominated.
Session Delta:
Total delta for an entire session. Shows overall session bias. Useful for daily analysis.
Delta and Price Relationship
Confirmation:
Price rising with positive delta confirms buyer-driven move. Price falling with negative delta confirms seller-driven move. These are healthy, likely-to-continue moves.
Divergence:
Price rising but delta flat or negative suggests buyers are not aggressive. The rise may be seller withdrawal. Price falling but delta flat or positive suggests sellers are not aggressive. The drop may be buyer withdrawal. These divergences warn of potential reversal.
Cumulative Delta Patterns
Pattern 1: Rising Price with Rising Cumulative Delta
Healthy bullish move. Buyers are aggressive and in control. Expect continuation.
Pattern 2: Rising Price with Flat or Falling Cumulative Delta
Bearish divergence. Price is rising but buying aggression is not supporting it. Expect potential reversal or pullback.
Pattern 3: Falling Price with Falling Cumulative Delta
Healthy bearish move. Sellers are aggressive and in control. Expect continuation.
Pattern 4: Falling Price with Flat or Rising Cumulative Delta
Bullish divergence. Price is falling but selling aggression is not supporting it. Expect potential reversal or bounce.
Delta Extremes
Watching for delta extremes helps identify exhaustion:
Delta Spike on Up Move:
A sudden surge in positive delta at the end of an up move may indicate exhaustion. All buyers have already bought, leaving fewer buyers to push price higher.
Delta Spike on Down Move:
A sudden surge in negative delta at the end of a down move may indicate exhaustion. All sellers have already sold, leaving fewer sellers to push price lower.
Delta with SMC
Integrate delta analysis with your SMC framework:
At Order Blocks: When price reaches an order block, check delta. Positive delta at a bullish OB confirms buyer defense. Negative delta at a bullish OB warns the level may fail.
At Liquidity Sweeps: During a liquidity sweep, extreme delta often appears as stops trigger. Watch delta after the sweep for reversal signals.
During Displacement: Strong displacement moves should show corresponding delta. An impulse up should have strong positive delta. If not, question the conviction of the move.
Trading with Delta
Confirmation Use:
Use delta to confirm your SMC setups. A bullish order block with positive delta as price taps it is higher probability than one with neutral or negative delta.
Divergence Warning:
Use delta divergence to manage trades. If holding a long and you notice cumulative delta flattening while price rises, consider tightening stops or taking partial profits.
Entry Timing:
Wait for delta to turn in your favor before entering. At a bullish level, wait for a positive delta candle before going long.
Delta Limitations
Delta is not perfect:
In thin markets, delta can be erratic. Large passive orders can distort delta readings. Different platforms may calculate delta slightly differently. Delta works best in liquid markets during active sessions.
Practical Delta Application
Daily Routine:
At session start, note cumulative delta from the previous session. During the session, monitor cumulative delta direction. At SMC levels, check candle delta for confirmation. After session, review how delta aligned with price movement.
Key Takeaways
Delta measures buying volume minus selling volume at price levels. Positive delta indicates buying aggression; negative delta indicates selling aggression. Cumulative delta shows the trend of aggression over time. Delta divergence from price warns of potential reversal. Use delta to confirm SMC setups and manage existing trades.