
While price charts show you where the market has been, Order Flow analysis shows you how it got there. By examining the actual transactions and orders that create price movement, you gain insight that traditional charting cannot provide.
What is Order Flow?
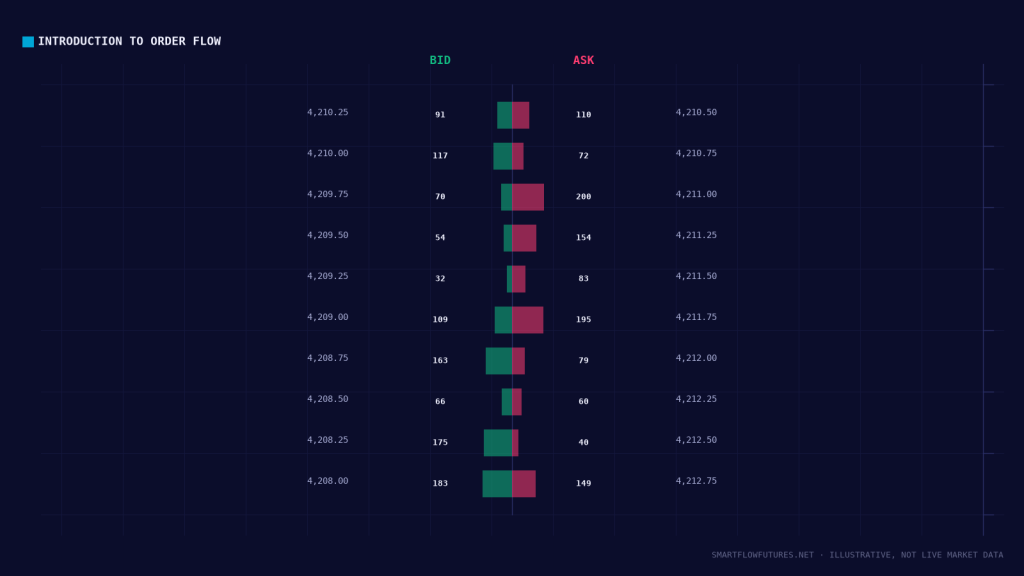
Order Flow refers to the stream of buy and sell orders flowing into the market. Every price movement is the result of orders being filled: someone buying from someone selling. Order Flow analysis examines this transaction-level data to understand market dynamics.
Think of it this way: a candlestick chart is like watching the score of a game. Order Flow is like watching the actual game, seeing every play and every tackle.
Why Order Flow Matters
Price charts have limitations:
They cannot show whether buying or selling was more aggressive, or reveal if large players are absorbing orders at a level. They cannot distinguish between high-conviction moves and low-volume drifts, and they cannot show you the orders waiting to be filled.
Order Flow fills these gaps, providing context that makes price movement meaningful.
Core Order Flow Concepts
Market Orders vs. Limit Orders:
Market orders are executed immediately at the best available price. They represent urgency. These are traders who need to get in or out now. Limit orders rest in the order book waiting to be filled. They represent levels where traders are willing to transact.
Price moves when market orders consume limit orders. Aggressive buyers hitting the ask (limit sells) push price up. Aggressive sellers hitting the bid (limit buys) push price down.
The Bid and Ask:
The Bid is the highest price buyers are willing to pay. The Ask is the lowest price sellers are willing to accept. The difference is the spread. Transactions occur when orders cross this spread.
Volume at Price:
Every transaction has a price and a volume. By aggregating volume at each price level, you can see where the most activity occurred. This reveals levels of significance.
Order Flow Tools
Several tools are used to analyze Order Flow:
Depth of Market (DOM): Shows resting limit orders at each price level above and below current price. Reveals where support and resistance might form.
Time and Sales (Tape): Shows every individual transaction as it occurs. Reveals the pace and size of trading activity.
Footprint Charts: Shows the volume of buys versus sells at each price within a candle. Reveals the internal battle within price movement.
Volume Profile: Shows total volume traded at each price over a period. Reveals the prices where the market has found value.
Delta: The difference between buying volume and selling volume. Shows which side is more aggressive.
Order Flow and SMC
Order Flow and Smart Money Concepts are complementary:
SMC tells you where to look (order blocks, FVGs, liquidity). Order Flow tells you what is happening when price gets there. SMC provides the context; Order Flow provides the confirmation.
For example, you identify a bullish order block using SMC. Price returns to this level. Order Flow shows heavy buying absorption there. This confirms institutional defense of the level: the combination is confluence, and it increases the probability the setup works.
Basic Order Flow Reading
Aggressive Buyers:
High volume of transactions at the ask price. Delta is strongly positive. Price lifting through ask levels quickly. Indicates buying urgency and likely continuation higher.
Aggressive Sellers:
High volume of transactions at the bid price. Delta is strongly negative. Price falling through bid levels quickly. Indicates selling urgency and likely continuation lower.
Absorption:
High volume at a level without price moving through it. One side is absorbing the other sides aggression. Often signals reversal or stall.
Getting Started with Order Flow
If you are new to Order Flow:
1. Start with the DOM: Learn to read the depth of market. Watch how limit orders stack and deplete at price levels.
2. Watch the Tape: Observe Time and Sales during active sessions. Notice the pace, size, and direction of transactions.
3. Add Footprint Charts: Overlay footprint data on your candlestick charts. See how the internal volume shapes each candle.
4. Study Volume Profile: Mark significant volume nodes on your charts. These become reference levels.
Platform Requirements
Not all platforms provide Order Flow data:
Basic Platforms: May only show standard candlesticks and basic volume. Limited Order Flow capability.
Advanced Platforms: Platforms like NinjaTrader, Sierra Chart, ATAS, and Bookmap provide comprehensive Order Flow tools including footprint charts, DOM, and volume profile.
Data Requirements: Real-time Order Flow analysis requires tick-by-tick data feeds, which may have additional costs.
Key Takeaways
Order Flow shows you the transactions and orders that create price movement. It reveals information that price charts alone cannot show. Core tools include the DOM, Time and Sales, Footprint Charts, and Volume Profile. Order Flow complements SMC by providing confirmation at key levels. Start with basic concepts before advancing to complex Order Flow analysis.