
The Depth of Market (DOM), also known as the order book or price ladder, is your window into resting liquidity. It shows you where limit orders are stacked, revealing potential support and resistance before price arrives.
What is the DOM?
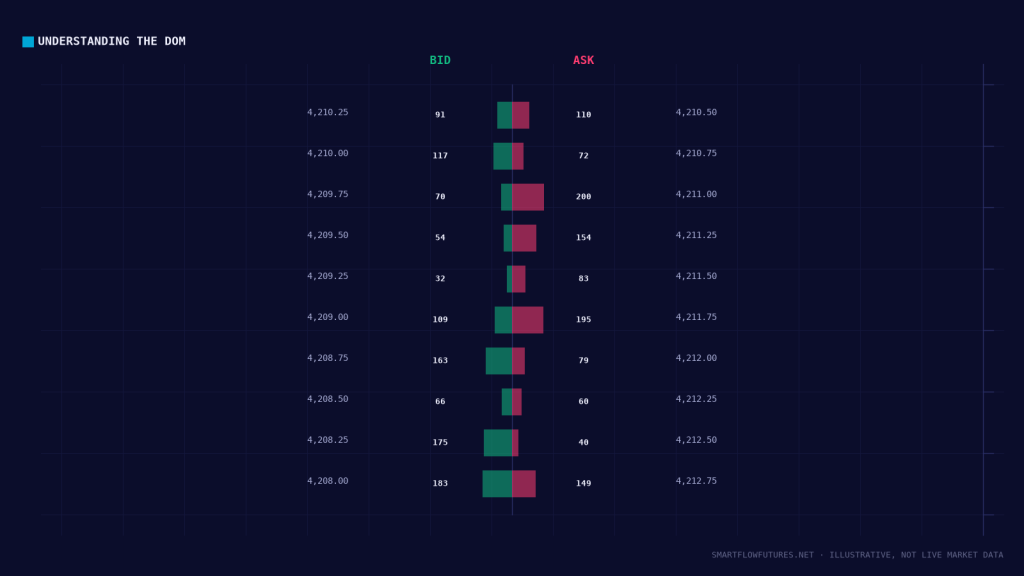
The DOM displays all visible limit orders resting in the market at each price level. It typically appears as a vertical ladder with the current price in the middle, bids (buy limit orders) stacking below, and asks (sell limit orders) stacking above.
Unlike a price chart that shows historical transactions, the DOM shows current intentions (orders waiting to be filled). This is forward-looking information.
Reading the DOM
The Bid Side (Below Current Price):
Shows buy limit orders waiting to be filled. Larger numbers indicate more buying interest at that level. When price drops to these levels, these orders can absorb selling and potentially support price.
The Ask Side (Above Current Price):
Shows sell limit orders waiting to be filled. Larger numbers indicate more selling interest at that level. When price rises to these levels, these orders can absorb buying and potentially resist price.
The Spread:
The gap between the best bid and best ask. Tighter spreads indicate more liquidity. Wider spreads suggest less activity or higher volatility.
DOM Dynamics
The DOM is constantly changing:
Orders Being Added: Traders place new limit orders, increasing size at certain levels. Watch for levels where size builds. These become significant.
Orders Being Pulled: Traders cancel limit orders before they are hit. Large orders disappearing can signal lack of conviction at that level.
Orders Being Filled: Market orders consume resting limits. Watch how quickly levels get cleared. This shows aggression.
Significant DOM Patterns
Stacked Orders:
Large size builds at a specific level. This suggests significant interest, either institutional positioning or psychological importance. Price may react at these levels.
Thin Levels:
Minimal orders at certain prices. Price can move quickly through thin areas. These create potential for fast moves once triggered.
Iceberg Detection:
A level shows moderate size, but as orders are filled, more appears. This suggests hidden (iceberg) orders, large traders masking their true size.
Spoofing Patterns:
Large orders appear and disappear without being filled. This can be manipulation to move price. Be cautious of levels that repeatedly build and vanish.
DOM Trading Techniques
Technique 1: Level Identification
Before entering trades, check the DOM for significant orders between your entry and target. Large resting orders may slow or stop your trade. Plan accordingly.
Technique 2: Absorption Reading
Watch a level as price approaches. If large resting orders are hit and refill repeatedly, absorption is occurring. This suggests strong defense and potential reversal.
Technique 3: Breakout Confirmation
When price approaches a level with large resting orders, watch how those orders behave. If they get pulled before price arrives, the level may not hold. If they remain and get consumed, the break is more likely real.
DOM and SMC Integration
Use the DOM to confirm SMC levels:
At Order Blocks: When price reaches your order block, check the DOM. Is there significant resting size supporting your thesis? Large bids at a bullish order block confirm institutional defense.
At Liquidity Pools: Before a liquidity sweep, you might see large resting orders (the stops). Watch how they get consumed and what appears after.
At FVGs: When price enters an FVG, the DOM can show if buyers or sellers are defending the zone.
DOM Limitations
The DOM is not perfect:
Only Shows Visible Orders: Hidden orders, iceberg orders, and orders on other venues are not displayed.
Constantly Changing: What you see can disappear in milliseconds. Do not rely on static readings.
Subject to Manipulation: Spoofing and layering can create false signals. Large orders may be fake.
Requires Fast Interpretation: In fast markets, the DOM changes faster than you can process it.
Practical DOM Usage
For most traders, the DOM is best used as confirmation rather than primary analysis:
Primary Analysis: Use SMC concepts to identify trade locations.
DOM Confirmation: When price reaches your level, glance at the DOM for supporting evidence. Is there size defending your thesis?
Trade Management: Use the DOM to identify potential obstacles between entry and target.
Setting Up Your DOM
Platform-specific setup varies. At minimum, configure the following:
Displaying enough levels above and below current price (10-20 typically). Showing volume at each level clearly. Color coding bids and asks distinctly. Updating in real-time with minimal lag.
Key Takeaways
The DOM shows resting limit orders at each price level (this is forward-looking information). Bids stack below current price; asks stack above. Significant size at levels can indicate support or resistance. Watch for absorption (orders refilling) as a reversal signal. Use DOM to confirm SMC analysis rather than as standalone strategy.