
Footprint charts represent the evolution of Order Flow visualization. Unlike traditional candlesticks that only show open, high, low, and close, footprint charts reveal the actual volume traded at each price within the candle. This granular view exposes the internal battle between buyers and sellers.
What Are Footprint Charts?
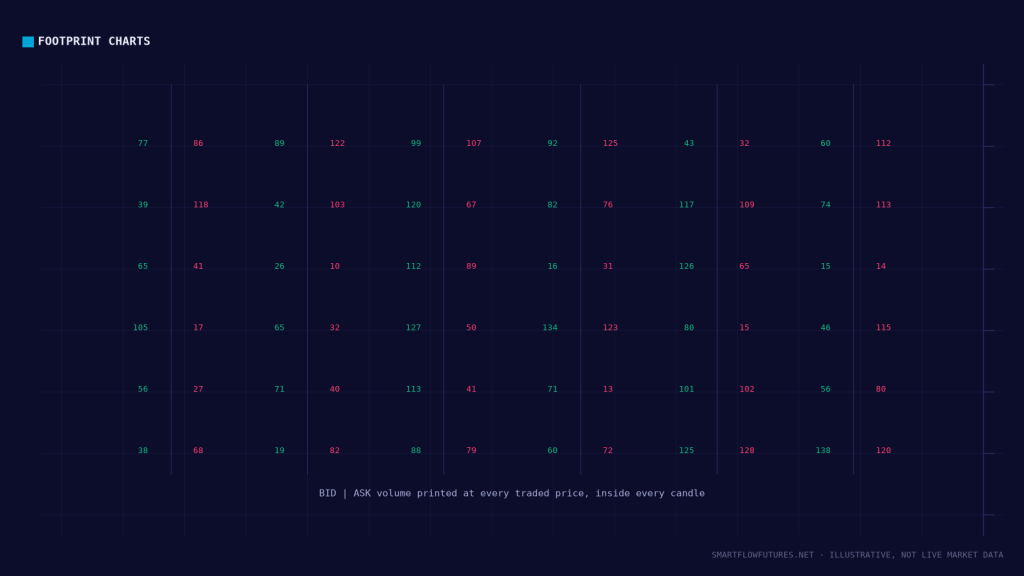
A footprint chart overlays volume data onto a candlestick framework. Each candle is broken down into the individual price levels traded during that period. At each price, you see how much volume was transacted, and critically, how much was traded at the bid versus the ask.
This transforms the candle from a summary of price movement into a detailed record of trading activity.
Footprint Chart Types
Bid x Ask Footprint:
The most common type. Shows volume traded at bid and volume traded at ask for each price level. Typically displayed as “Bid volume x Ask volume” or with separate columns.
Delta Footprint:
Shows the difference between ask volume and bid volume at each price. Positive delta indicates more buying aggression. Negative delta indicates more selling aggression.
Volume Footprint:
Shows total volume at each price without bid/ask separation. Useful for identifying high-volume nodes but loses the directional information.
Imbalance Footprint:
Highlights price levels where the ratio between bid and ask volume exceeds a threshold (often 300% or more). These imbalances show one-sided aggression.
Reading Footprint Charts
Identifying Aggression:
Look at where volume occurs relative to the candle structure. Volume heavy at the highs suggests aggressive buying. Volume heavy at the lows suggests aggressive selling.
Finding Imbalances:
Stacked imbalances (multiple consecutive price levels with one-sided volume) indicate strong directional conviction. Buying imbalances stack upward; selling imbalances stack downward.
Spotting Absorption:
High volume at a level with price not moving through it. One side is absorbing the other. Visible as large bid volume at the low of a candle that held, or large ask volume at the high that capped price.
Reading Delta:
The cumulative delta of the candle shows net aggression. Positive delta with a bullish candle confirms buyer control. Negative delta with a bullish candle suggests hidden weakness.
Footprint Patterns
Pattern 1: Stacked Buying Imbalances
Multiple price levels in a row show buying imbalance (much more volume at ask than bid). Indicates aggressive buyers lifting offers. Often marks the initiation of a move higher.
Pattern 2: Stacked Selling Imbalances
Multiple price levels in a row show selling imbalance (much more volume at bid than ask). Indicates aggressive sellers hitting bids. Often marks the initiation of a move lower.
Pattern 3: Absorption at Low
Heavy volume at the candle low, but price closes higher. Sellers were aggressive, but buyers absorbed the selling. Potential reversal or support confirmation.
Pattern 4: Absorption at High
Heavy volume at the candle high, but price closes lower. Buyers were aggressive, but sellers absorbed the buying. Potential reversal or resistance confirmation.
Pattern 5: Low Volume Node
A price level with minimal volume. Price moved through quickly without much participation. These areas offer little support or resistance.
Footprint with SMC
Combine footprint analysis with SMC levels:
At Order Blocks: When price returns to an order block, check the footprint. Absorption patterns confirm institutional defense. Imbalances in your favor confirm the setup.
At FVGs: Fair Value Gaps show where price moved without sufficient volume. Footprint charts visualize this—the FVG area will show low volume compared to surrounding levels.
During Liquidity Sweeps: Watch the footprint as price sweeps a high or low. The volume pattern reveals whether the sweep was genuine or a trap.
Delta Analysis
Delta (buying volume minus selling volume) provides a summary measure:
Candle Delta: The total delta for the entire candle. Positive means buyers won; negative means sellers won.
Cumulative Delta: Running total of delta over time. Rising cumulative delta with rising price is healthy. Divergence between price and cumulative delta can signal weakness.
Delta at Price: Delta calculated at each price level within the candle. Shows where within the candle buyers or sellers dominated.
Setting Up Footprint Charts
Different platforms offer different footprint implementations:
NinjaTrader has native footprint support and popular add-ons. Sierra Chart offers detailed footprint customization. ATAS specializes in Order Flow with excellent footprint tools. Some platforms require third-party indicators.
Configure your footprint with clear color coding, appropriate time intervals, and imbalance thresholds that suit your trading.
Practical Footprint Usage
Pre-Trade: Identify key levels on traditional charts using SMC analysis.
At Levels: Switch to footprint view when price reaches your levels. Look for confirming patterns (absorption, imbalances).
Entry Confirmation: Use footprint signals as your final confirmation before executing.
Trade Management: Monitor footprint during your trade for signs of exhaustion or continuation.
Key Takeaways
Footprint charts show volume traded at each price within a candle. Bid x Ask footprints reveal whether buyers or sellers were more aggressive. Imbalances (one-sided volume) indicate strong directional conviction. Absorption patterns show defense at key levels. Combine footprint analysis with SMC levels for confirmation and timing.