
Multi-timeframe analysis sounds straightforward in theory but can be confusing in practice. This article walks through complete examples showing exactly how to flow from higher timeframe bias to trading timeframe setup to execution timeframe entry.
The MTF Framework Review
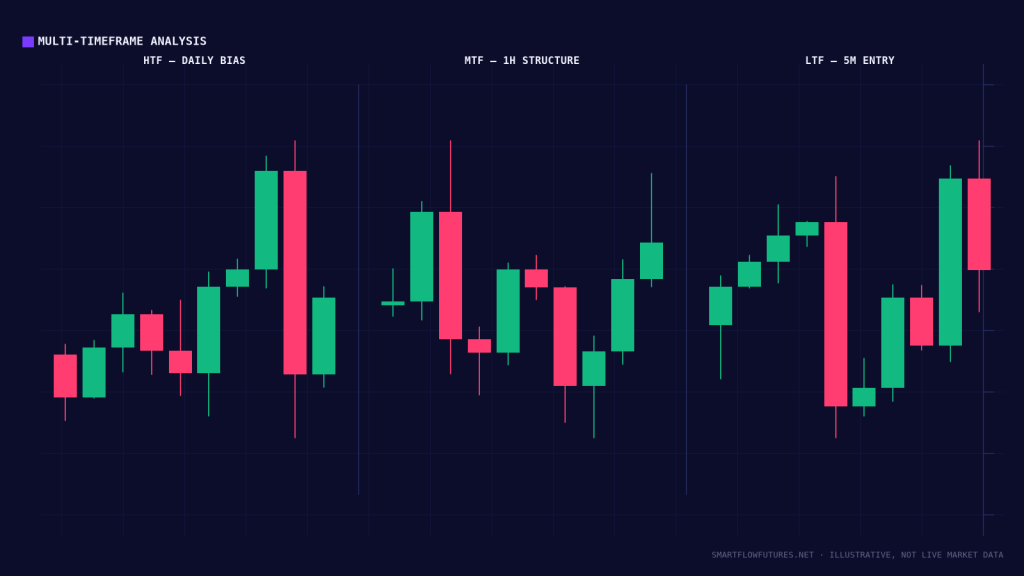
Quick reminder of the three-timeframe approach:
Higher Timeframe (Daily/4H): Establishes directional bias. Identifies major structure and key levels. Tells you which direction to trade.
Trading Timeframe (15M/1H): Identifies specific setups. Marks order blocks, FVGs, and liquidity. Tells you where to look for trades.
Execution Timeframe (1M/5M): Refines entry timing. Confirms setups with Order Flow. Tells you when to enter.
Example 1: Clean Bullish Alignment
Daily Chart Analysis:
ES daily shows clear uptrend with higher highs and higher lows. Price recently broke above 4,500 resistance. Now pulling back toward 4,480 area. Bullish order block at 4,460-4,475 from the breakout. Bias: Bullish. Looking for longs only.
15M Chart Analysis:
Current price: 4,495. Price has retraced from 4,520 high. FVG exists at 4,475-4,485 (aligns with daily OB area). Equal lows at 4,470 (liquidity below). Setup: Wait for price to reach 4,475-4,485 FVG zone.
5M Execution:
Price drops to 4,478 (inside FVG). 5M shows bullish engulfing candle. Footprint shows buying absorption and delta flip. Entry: Long at 4,482. Stop: Below 4,468 (below liquidity and OB). Target 1: 4,510. Target 2: 4,530.
Result: All timeframes aligned. Entry had confirmation. Classic high-probability MTF setup.
Example 2: Conflicting Timeframes
Daily Chart Analysis:
NQ daily shows range-bound action for two weeks. No clear bias. Price has been oscillating between 17,800 and 18,200. Currently in the middle of range at 18,000. Bias: Neutral. Need to be careful.
15M Chart Analysis:
Current structure shows bullish momentum. 15M broke structure to upside. Bullish FVG at 17,950-17,970. Looks like a valid long setup.
The Conflict:
15M looks bullish but daily is range-bound. In a range, both longs and shorts can work, but neither has higher timeframe support. This is a lower probability situation.
How to Handle:
Option 1: Skip the trade until daily provides clearer bias. Option 2: Take the trade with reduced size, expecting range behavior. Option 3: Trade to range high as target rather than extended target.
Lesson: When timeframes conflict, reduce expectations and size.
Example 3: Counter-Trend on Lower Timeframe
Daily Chart Analysis:
GC (Gold) daily is strongly bearish. Lower highs, lower lows for three weeks. Currently at 1,920, down from 1,980. Bias: Bearish. Looking for shorts.
15M Chart Analysis:
Price has been dropping. Now approaching 1,910 support level. 15M showing potential bullish setup: possible order block for longs. Temptation: Take the long setup.
The Right Approach:
Daily is bearish. 15M bullish setup is counter-trend. Options: Skip the counter-trend long. Wait for the 15M long to fail and short the failure. Wait for 15M structure to turn bearish and align with daily.
Lesson: Resist the urge to trade against higher timeframe direction, even when lower timeframe shows setups.
Example 4: Using Lower Timeframe to Refine
Setup:
Daily bearish on ES. 15M shows bearish order block at 4,520-4,530. Price approaching the zone.
5M Refinement:
As price enters 15M OB zone, drop to 5M. Watch for: rejection candle, CHOCH on 5M, Order Flow absorption.
Without 5M confirmation: Price could continue through the OB. Entry would be blind.
With 5M confirmation: Price hits 4,525, 5M shows bearish engulfing. Footprint shows selling absorption. Now enter short with confidence.
Lesson: The execution timeframe does more than time the entry. It confirms that the setup is actually working.
MTF Analysis Workflow
Daily routine for MTF analysis:
Pre-Session (Daily): What is the overall bias? Where are the major levels? What would need to happen to change bias?
Pre-Session (15M): Where are today setups? Mark OBs, FVGs, liquidity. Create a plan: “If price reaches X, I will look for Y.”
During Session (5M): When price reaches your 15M levels, watch 5M. Wait for confirmation before entering. Execute when alignment exists.
Key Takeaways
Higher timeframe sets bias; trading timeframe identifies setups; execution timeframe confirms entry. When timeframes align, probability is highest. When timeframes conflict, reduce size or skip the trade. Use lower timeframe to refine entry, not to find setups that contradict higher timeframe. Daily MTF routine: bias from daily, setups from 15M, confirmation from 5M.