
Beyond daily and weekly patterns, institutional behavior follows quarterly rhythms tied to reporting periods, rebalancing schedules, and fiscal cycles. Understanding Quarterly Theory helps you align with these larger patterns that drive significant market moves.
Why Quarters Matter
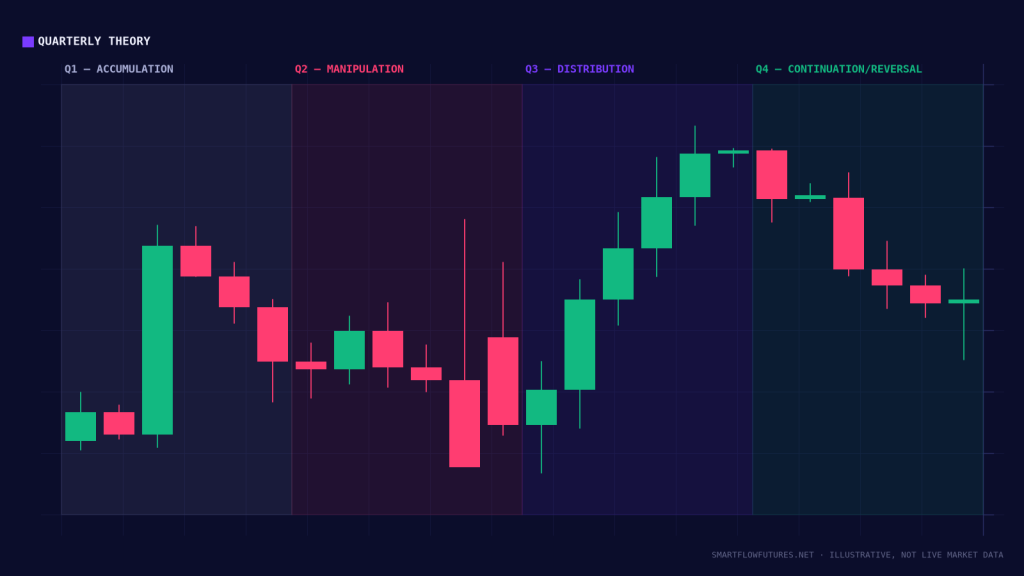
Institutional investors operate on quarterly timelines:
Reporting Requirements: Mutual funds, pension funds, and hedge funds report quarterly. They position to show favorable results at quarter-end.
Rebalancing: Many funds rebalance portfolios quarterly. This creates predictable flows at specific times.
Corporate Earnings: Earnings seasons occur quarterly, driving significant price action.
Economic Cycles: GDP and other major economic data are reported quarterly, influencing market direction.
The Four Quarters
Q1 (January – March):
New year capital flows. January effect in equities. Fresh annual allocations deployed. Trend often established for the year.
Q2 (April – June):
“Sell in May” phenomenon. Tax-related positioning. Summer lull begins late Q2. Often sees profit-taking from Q1 moves.
Q3 (July – September):
Lower volume summer months. August can see sharp moves in thin markets. September historically volatile. Q4 positioning begins.
Q4 (October – December):
Historically strong period. Year-end window dressing. Santa Claus rally potential. Tax-loss selling early, then recovery.
ICT Quarterly Theory
In SMC/ICT methodology, each quarter is divided into three phases that mirror the weekly Power of Three:
Month 1 (Accumulation): Smart money quietly builds positions. Price may range or show minor directional bias. Liquidity is being accumulated.
Month 2 (Manipulation): False moves trap retail traders. Major stop hunts and reversals. The setup for the real move.
Month 3 (Distribution): The real move unfolds. Smart money distributes to late participants. Significant trending typically occurs.
Applying Quarterly Phases
During Accumulation (Month 1):
Be patient with position building. Expect ranges and false breakouts. Look for higher timeframe levels being tested. Dont chase—positions are being built quietly.
During Manipulation (Month 2):
Watch for stop hunts at obvious levels. Dont get trapped by false signals. Wait for manipulation to complete. Prepare for the distribution phase move.
During Distribution (Month 3):
Trade with the emerging trend. This is when the real move happens. Trend continuation setups work well. Be positioned before the quarter ends.
Quarter Open Levels
The opening price of each quarter becomes a key reference:
Mark the quarterly open on your charts. Price often returns to test this level. Closes above quarterly open: quarterly bullish bias. Closes below: quarterly bearish bias. These levels can act as support/resistance for months.
Quarter-End Dynamics
Special patterns emerge at quarter-end:
Window Dressing: Fund managers buy winning stocks and sell losers to improve quarterly reports. This creates artificial support for winners and pressure on losers.
Rebalancing Flows: Large, predictable flows as funds rebalance. Can create opportunities or traps depending on positioning.
Volatility: Final trading days of quarters often see increased volatility as positions are adjusted.
Earnings Season Alignment
Each quarter has an earnings season (typically weeks 4-8 of the quarter) that dominates price action:
Major tech earnings can move entire indices. Bank earnings kick off each season. Forward guidance matters as much as results. Position sizing should account for earnings volatility.
Combining Timeframes
Quarterly theory works best when combined with other timeframes:
Quarterly Direction: Provides the macro bias (are we in accumulation, manipulation, or distribution?).
Monthly Context: Which month of the quarter are we in?
Weekly Execution: What is the weekly pattern within this months phase?
Daily Trades: Execute based on daily setups that align with higher timeframe analysis.
Practical Quarterly Trading
How to apply quarterly theory:
Quarter Start: Mark the quarterly open. Note the current phase (which month). Review previous quarters move for context. Establish quarterly directional hypothesis.
During Quarter: Adjust expectations based on month (accumulation, manipulation, distribution). Look for phase-appropriate setups. Dont fight the quarterly trend.
Quarter End: Be aware of rebalancing and window dressing. Consider reducing exposure into quarter-end volatility. Prepare analysis for the upcoming quarter.
Limitations
Important caveats about quarterly theory:
Its a framework, not a precise calendar. Central bank policy can override quarterly patterns. Major events (crises, elections) disrupt normal cycles. Dont use quarterly theory in isolation—combine with other analysis.
Key Takeaways
Institutional behavior follows quarterly reporting and rebalancing cycles. Each quarter has three phases: accumulation, manipulation, distribution. The quarterly open is a key reference level. Quarter-end sees special dynamics from window dressing and rebalancing. Combine quarterly theory with weekly and daily analysis for best results.