
While Fair Value Gaps are the most discussed form of imbalance, understanding the broader concept of market inefficiency is essential for SMC traders. In this article, we explore how imbalances form, why they matter, and how to trade them effectively.
The Concept of Market Balance
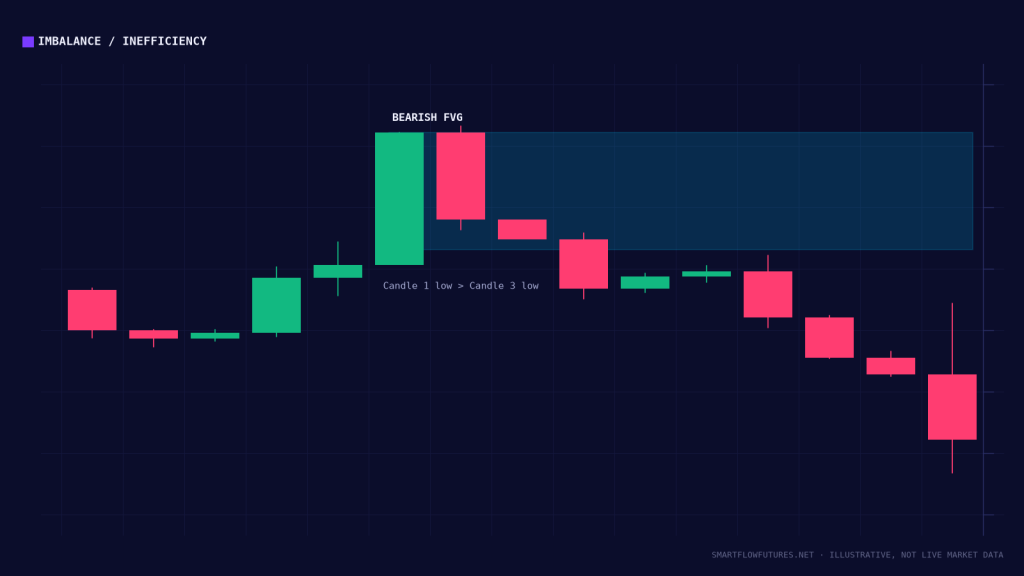
Markets are constantly seeking equilibrium, a state where buyers and sellers agree on fair value. When price moves in an orderly fashion with overlapping candles and wicks, we have balanced price action. Buyers and sellers are finding agreement at each price level.
Imbalance occurs when this equilibrium is disrupted. One side (buyers or sellers) overwhelms the other, causing price to move rapidly without the normal back-and-forth negotiation. These imbalanced moves leave behind zones where fair price discovery never occurred.
Types of Imbalances
Fair Value Gaps (FVGs): The classic three-candle pattern we’ve discussed, where wicks don’t overlap, leaving a visible gap.
Volume Imbalances: Candles with extremely high volume that moved price significantly. Even without a visible wick gap, the volume indicates one-sided aggression.
Opening Gaps: When markets open at a different price than they closed, common over weekends in futures. These gaps often get filled as markets seek balance.
Single Prints: In Market Profile terms, areas where price only traded once, indicating one-sided pressure.
Why Price Returns to Imbalances
Several theories explain why price gravitates back to imbalanced zones:
Unfilled Orders: During aggressive moves, not all orders get filled. Traders who missed entries may have resting orders in the imbalanced zone, creating a magnetic effect.
Value Seeking: Markets naturally seek to establish fair value through two-sided trading. Imbalanced zones never had this negotiation.
Institutional Interest: Institutions that initiated the move may want to add to positions. They wait for price to return to favorable levels.
Measuring Imbalance Severity
Not all imbalances carry equal weight. Assess severity by considering:
Size of the Move: Larger, more aggressive moves indicate stronger imbalance. A 50-point move in ES creates more imbalance than a 10-point move.
Speed of the Move: Faster moves typically mean more imbalance. A move completed in 2 candles is more imbalanced than the same distance over 10 candles.
Volume Context: High volume during the move confirms institutional participation and increases imbalance significance.
Gap Size: For FVGs, larger gaps typically indicate more severe imbalance.
Imbalance as Entry Zones
Imbalances provide excellent entry opportunities because:
Defined Risk: You can place stops beyond the imbalance zone for clear risk definition.
Favorable Prices: Entering at imbalances means entering at prices the market may view as inefficient: buying cheap or selling expensive.
Confluence: Imbalances often align with other SMC concepts, creating high-probability zones.
Trading Imbalances: The Process
Step 1: Identify the Imbalance
Look for FVGs, gaps, or aggressive single-candle moves that suggest one-sided pressure.
Step 2: Assess Quality
Consider timeframe, size, freshness, and alignment with trend. Higher quality imbalances deserve more attention.
Step 3: Wait for Return
Be patient. Price may take time to return to the imbalance zone. Don’t chase. Let the market come to you.
Step 4: Look for Reaction
When price enters the zone, watch for signs of reaction: rejection wicks, reversal patterns, or structure breaks on lower timeframes.
Step 5: Execute with Confirmation
Enter trades when you have both the imbalance zone and confirmation of reaction.
Imbalance Filling
Understanding how imbalances get filled helps with trade management:
Touch and Go: Price touches the edge of the imbalance and reverses immediately. Often seen in strong trends.
Partial Fill: Price enters the imbalance but reverses before completing the fill. Common at the 50% level.
Full Fill: Price trades completely through the imbalance, closing the inefficiency. Zone loses significance afterward.
Overshoot: Price moves beyond the imbalance before reversing. This can trigger stops before the expected move occurs.
Combining with Market Structure
Imbalances work best when aligned with market structure:
In Uptrends: Focus on bullish imbalances (upward FVGs) as potential support for buying pullbacks.
In Downtrends: Focus on bearish imbalances (downward FVGs) as potential resistance for selling rallies.
At Structure Points: Imbalances near swing highs/lows carry extra significance as they coincide with structural levels.
Time Decay of Imbalances
Imbalances don’t last forever. Their relevance fades over time:
Fresh Imbalances (hours to days): Highest probability of reaction.
Aging Imbalances (days to weeks): Still relevant but monitor for structural changes.
Old Imbalances (weeks to months): May still matter on higher timeframes but require additional confluence.
Ancient Imbalances: Generally lose relevance as market context has likely changed significantly.
Key Takeaways
Imbalances represent market inefficiencies where fair price discovery didn’t occur. They come in various forms: FVGs, volume imbalances, opening gaps, and single prints. Markets naturally seek to return to imbalanced zones to establish fair value. Quality assessment is essential. Not all imbalances are tradeable. Combine imbalances with market structure and other SMC concepts for highest probability setups.