
Swing Points and Market Phases: Reading Price Action
Markets move in cycles. Understanding these cycles—and the swing points that define them—gives you insight into where we are in the bigger picture. This knowledge helps you anticipate what comes next rather than just reacting to what already happened.
Identifying Swing Points
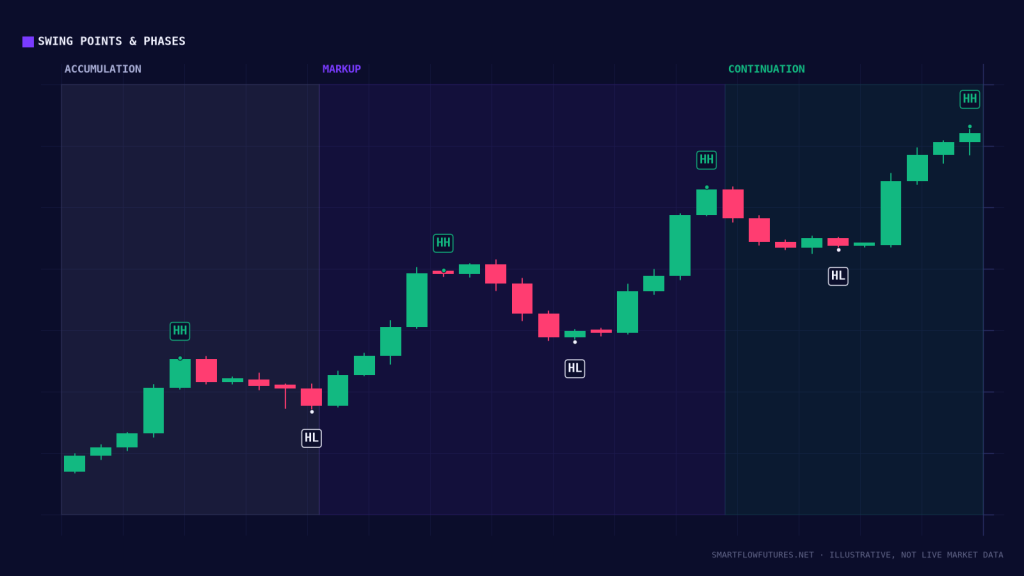
A swing point is where price changes direction. But not every wiggle is a true swing point. We look for significant swing points: areas where price clearly rejected and reversed with conviction.
Swing High: A peak where price pushed up, rejected, and moved lower. The bars before and after are lower than the swing high bar.
Swing Low: A trough where price pushed down, rejected, and moved higher. The bars before and after are higher than the swing low bar.
Filters for Significant Swings
To avoid labeling noise as swing points, check for a real move leading into it, a clear and decisive rejection, a real move away from it afterward, and confirmation on higher timeframes.
The Four Market Phases
Markets cycle through four distinct phases. Understanding where you are helps you choose appropriate strategies.
1. Accumulation Phase
After a downtrend, price enters a range. It looks like sideways consolidation, but underneath, smart money is buying. Retail sees this as a boring market, but institutions are quietly accumulating positions at discount prices.
Characteristics: Sideways price action, decreasing volatility, lower volume, price holds above recent lows.
Trading approach: Wait for breakout confirmation before entering longs.
2. Markup Phase
After accumulation, price breaks out and trends higher. This is the uptrend phase where institutional buying drives price up. Retail traders finally notice and join in.
Characteristics: Higher highs and higher lows, increasing volume on up moves, pullbacks are shallow and brief.
Trading approach: Buy pullbacks to order blocks in discount zones.
3. Distribution Phase
After an extended uptrend, price enters another range. It looks like consolidation, but smart money is selling to eager retail buyers. The trend stalls but hasn’t reversed yet.
Characteristics: Sideways price action at highs, decreasing momentum, potential lower highs forming, smart money exiting longs.
Trading approach: Take profits on longs, prepare for potential reversal.
4. Markdown Phase
After distribution, price breaks down and trends lower. Institutional selling drives price down. Retail traders who bought the top are now panic selling.
Characteristics: Lower highs and lower lows, increasing volume on down moves, rallies are shallow and brief.
Trading approach: Sell rallies to order blocks in premium zones.
Identifying Current Phase
To identify the current phase, analyze the swing point structure. Are we making HH/HL (markup), LH/LL (markdown), or equal highs/lows (accumulation/distribution)? Consider volume patterns: is volume increasing or decreasing, and does it support the current move? Look at where we are relative to the previous cycle and whether we have had an extended trend that might be ending.
Using Phases for Trade Selection
Stay out during accumulation and wait for the breakout. Markup calls for long trades, bought on pullbacks. In distribution, take profits and trim position size. Markdown favors short trades, sold into rallies.
Trying to catch reversals during accumulation/distribution is challenging. It’s easier to trade the clear trends of markup and markdown phases.
Multi-Timeframe Phase Analysis
Different timeframes can be in different phases. The daily might be in markup while the 1-hour is in distribution (pullback). The 4-hour might be in markdown while the 15-minute is in accumulation (building for continuation lower).
Understanding this hierarchy helps you make sense of seemingly conflicting signals.
Key Takeaways
Markets cycle through accumulation, markup, distribution, and markdown. Swing points define the structure within each phase. Trade with the phase: buy in markup, sell in markdown. Accumulation and distribution are transition periods—be patient. Multi-timeframe analysis reveals the bigger picture.