
The Power of Three (PO3), also known as AMD (Accumulation, Manipulation, Distribution), is a framework for understanding how institutional activity shapes daily price action. By recognizing which phase the market is in, you can align your trades with smart money flow.
The Three Phases
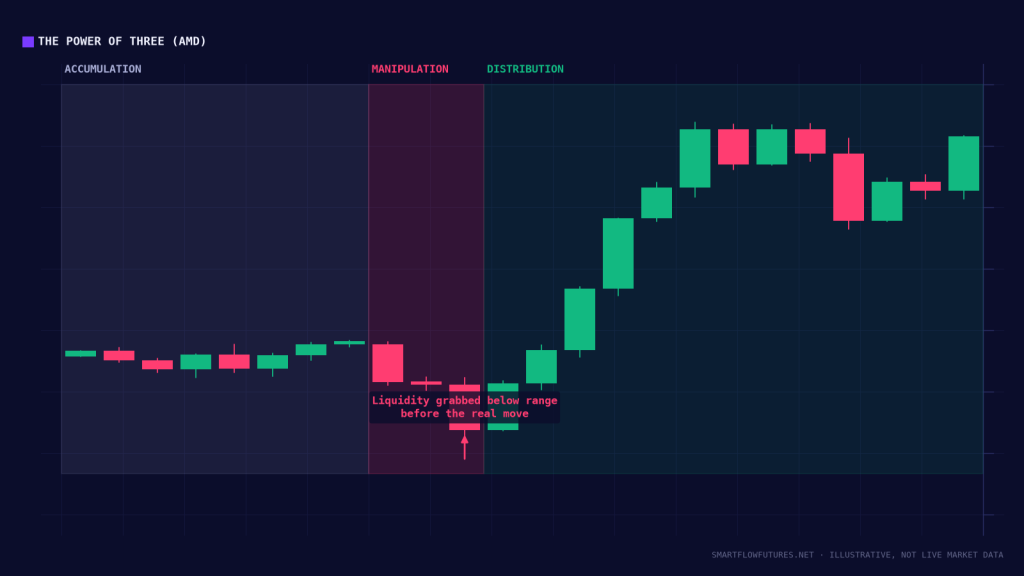
Phase 1: Accumulation
Institutions quietly build positions during quiet periods. Price consolidates in a range. Retail traders are often bored; nothing seems to be happening. Volume is typically lower than average. This phase often occurs during Asian session or early London.
Phase 2: Manipulation
Institutions create a false move to grab liquidity. Price breaks one side of the accumulation range. Stops are triggered; retail traders enter in the wrong direction. This is the “stop hunt” or “liquidity grab.” Often occurs at London open or NY open.
Phase 3: Distribution
The real move begins in the opposite direction of manipulation. Institutions distribute positions (sell to longs or buy from shorts). Price moves significantly, often for most of the session. Retail traders who were trapped now fuel the move as they exit.
Daily AMD Application
On a typical trading day:
Asian Session (Accumulation): Price builds a range. Identify the high and low. Prepare for manipulation of this range.
London Open (Manipulation): Watch for sweep of Asian high or low. This is the manipulation phase. Do not chase the initial move.
NY Session (Distribution): After manipulation, the distribution move begins. This is where you want to be positioned. Trade in the direction opposite the manipulation.
Trading the AMD Model
Step 1: Identify Accumulation
During Asian session, mark the range. Note both the high and low. Identify which side has more obvious liquidity.
Step 2: Anticipate Manipulation
When London or NY opens, expect one side to be swept. Do not trade the initial break. This is manipulation.
Step 3: Enter on Distribution
After manipulation is confirmed (sweep and rejection), enter in the distribution direction. Stop beyond the manipulation extreme. Target extends through the distribution phase.
AMD on Multiple Timeframes
AMD applies across timeframes:
Daily AMD: The framework described above (Asian accumulation, London manipulation, NY distribution).
Weekly AMD: Monday-Tuesday accumulation, Wednesday manipulation, Thursday-Friday distribution.
Monthly AMD: First week accumulation, second week manipulation, remaining weeks distribution.
Higher timeframe AMD takes precedence. Daily AMD should align with weekly AMD for best results.
Identifying the Manipulation Direction
How to know which way manipulation will go:
Higher Timeframe Bias: If HTF is bullish, manipulation often sweeps lows (sell-side), then distribution goes up.
Where is Liquidity: The more obvious liquidity pool is often targeted first.
Previous Session: If previous session ended strong in one direction, manipulation may fade that move.
You cannot always predict manipulation direction. Wait for it to occur, then trade the distribution.
Order Flow During AMD
Accumulation: Low volume, balanced delta. Market is quiet. Neither buyers nor sellers dominant.
Manipulation: Sudden volume spike. Aggressive delta in manipulation direction. Stops being triggered visible on tape.
Distribution: Delta reverses to distribution direction. Stacked imbalances in distribution direction. Volume supports the move.
AMD Examples
Bullish Day:
Asian session: NQ ranges 17800-17850.
London open: NQ drops to 17780, sweeping Asian low (manipulation down).
NY session: NQ reverses, rallies through 17850, reaching 17950 (distribution up).
Bearish Day:
Asian session: ES ranges 4500-4520.
London open: ES spikes to 4530, sweeping Asian high (manipulation up).
NY session: ES reverses, drops through 4500, reaching 4450 (distribution down).
When AMD Fails
AMD is a model, not a guarantee:
Trend Days: Sometimes there is no manipulation. Price trends all day. This often happens after significant news.
Multiple Manipulations: Sometimes price sweeps both sides of accumulation before distribution. Require clear rejection before entering.
No Distribution: Sometimes manipulation is followed by more accumulation rather than distribution. Wait for confirmation.
Key Takeaways
AMD describes daily flow: Accumulation (range), Manipulation (false break), Distribution (real move). Asian session often accumulates; London/NY often manipulates; NY often distributes. Do not trade the initial break. Wait for manipulation to complete. Enter on distribution after manipulation confirms (sweep and rejection). AMD applies across timeframes (daily, weekly, monthly). Use Order Flow to confirm each phase transition.