
Order Flow Confirmation: Validating SMC Setups
Learn how to use order flow data to confirm your SMC entries, avoid false signals, and trade with institutional backing.
Smart Money Concepts identify where institutions are likely to act, but order flow shows you when they are actually acting. By combining SMC analysis with real-time order flow confirmation, you transform probability-based setups into evidence-based trades. This article teaches you how to validate SMC setups using footprint charts, delta, cumulative delta, and tape reading.
Why Order Flow Confirmation Matters
Without Confirmation
- Trading based on historical levels only
- No proof institutions are active
- Higher rate of failed setups
- Entering before smart money acts
- Hoping the level holds
With Confirmation
- Real-time institutional evidence
- See aggressive buyers or sellers
- Filter out weak setups early
- Enter alongside smart money
- Know the level is being defended
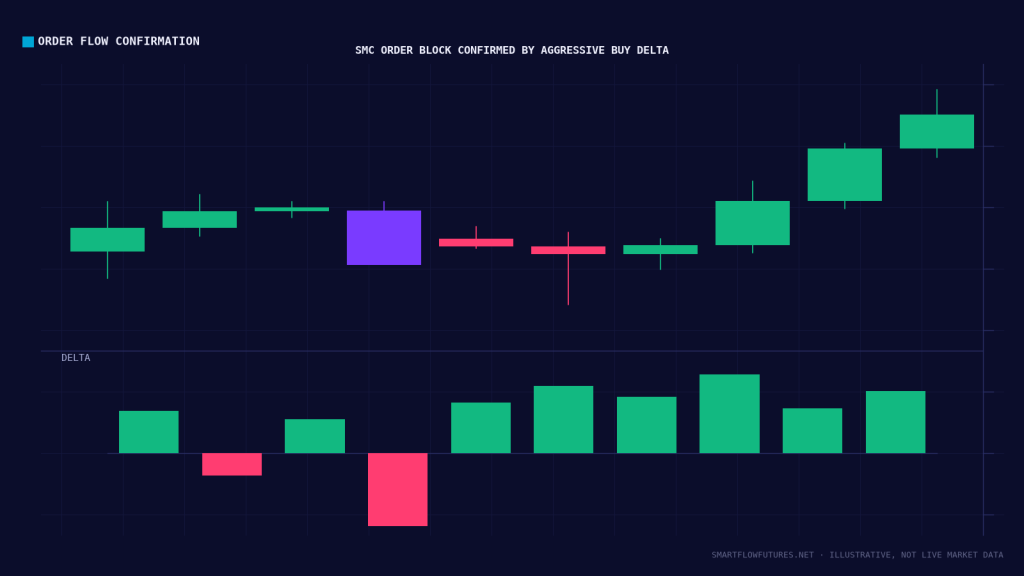
Order flow confirmation answers the question: Are institutions actually defending this level right now? If yes, enter with confidence. If no, wait or skip the trade.
Key Confirmation Signals
Bullish Order Block Confirmation
When price enters a bullish order block, look for these order flow signals:
- Absorption: Heavy selling volume with minimal price drop (buyers absorbing sells)
- Delta shift: Negative delta bars transitioning to positive delta
- Cumulative delta: Starts rising after making a low at the OB
- Tape: Large bid prints appearing, aggressive buyers lifting offers
- Footprint: Buying imbalances appearing at the OB level
Bearish Order Block Confirmation
When price enters a bearish order block, look for these order flow signals:
- Absorption: Heavy buying volume with minimal price rise (sellers absorbing buys)
- Delta shift: Positive delta bars transitioning to negative delta
- Cumulative delta: Starts falling after making a high at the OB
- Tape: Large offer prints appearing, aggressive sellers hitting bids
- Footprint: Selling imbalances appearing at the OB level
Confirmation by Setup Type
| SMC Setup | Order Flow Confirmation | What to Watch |
|---|---|---|
| Order Block Entry | Absorption + Delta Shift | Volume absorbed, delta reverses direction |
| FVG Fill | Aggressive Orders in Gap | Large prints as price enters FVG |
| Liquidity Sweep | Exhaustion + Reversal | Sweep candle shows opposite delta |
| BOS/CHOCH | Follow-Through Volume | Strong delta supporting the break |
| OTE Entry | Bid/Ask Imbalance | Footprint shows buying at fib level |
| Inducement Taken | Stop Run + Absorption | Stops trigger then price reverses |
Confirmation Workflow
Mark your order block, FVG, or liquidity level on the chart. Know your trade direction and where you want to enter.
Do not anticipate. Wait for price to actually enter your zone. Many levels never get tested.
When price reaches your level, switch focus to order flow. Watch the footprint, delta, and tape for confirmation signals.
Is absorption occurring? Is delta shifting? Are you seeing the signals described above?
If confirmation is present, execute your planned entry. If not, wait for more data or pass on the trade.
Invalidation Signals
Not every SMC level will hold. Order flow tells you when to stay out:
Price enters bullish order block but: delta remains strongly negative, no absorption visible, large sell prints continue on tape, cumulative delta keeps falling, price slices through with ease.
Price enters bearish order block but: delta remains strongly positive, no absorption visible, large buy prints continue on tape, cumulative delta keeps rising, price slices through with ease.
Sweep occurs but: delta does not reverse after sweep, no exhaustion visible, volume continues in sweep direction, price accelerates instead of reversing.
Practical Example
Example
SMC Analysis: 4H chart shows bullish market structure. Price is in discount zone. A bullish order block sits at 4520, overlapping with previous session POC.
Price reaches 4520: You switch to footprint chart and observe:
- First candle into OB shows 2000 contracts sold but price only drops 2 points (absorption)
- Delta on this candle is -1500 but price held
- Next candle shows delta of +800 (buyers stepping in)
- Cumulative delta, which had been falling, starts to flatten and turn up
- Time and sales shows 500-lot bid print (institutional buyer)
Conclusion: Order flow confirms institutional buying at the order block. Execute long entry with stop below the OB.
Order flow confirmation bridges the gap between SMC analysis and execution. Use absorption, delta shifts, cumulative delta reversals, and tape reading to validate that institutions are defending your levels. When confirmation is absent, have the discipline to pass on the trade. This filter alone can dramatically improve your win rate.