
Volume is the fuel that drives price movement. While basic volume analysis focuses on whether volume is high or low, advanced analysis examines volume patterns, distribution, and context to extract deeper market insight.
Volume in Context
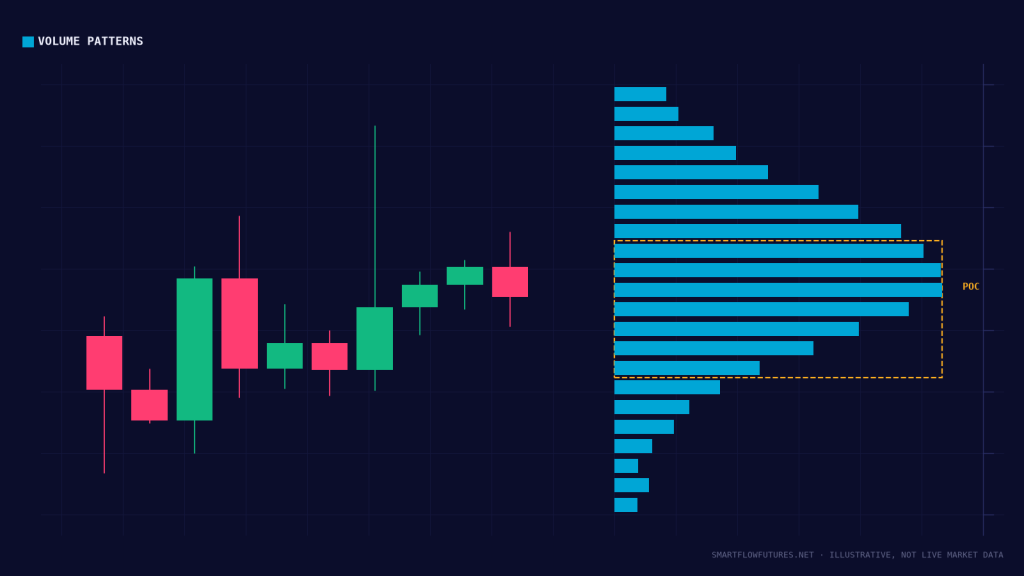
Raw volume numbers mean little without context:
Time of Day: Volume during NY killzone is typically 3-5x higher than overnight. “High” volume overnight might be “low” during regular hours.
Recent History: Compare current volume to recent sessions. Is today unusually active or quiet?
Event Calendar: Fed days, NFP, and other events create volume spikes. Context explains the volume.
Always interpret volume relative to what is normal for that context.
Volume and Price Movement
The relationship between volume and price reveals market conviction:
High Volume + Strong Move: Conviction behind the move. More likely to continue. Institutional participation likely.
High Volume + Small Move: Battle between buyers and sellers. Absorption occurring. May precede reversal or continuation after resolution.
Low Volume + Strong Move: Lack of participation. Move may not be sustainable. Often retraces.
Low Volume + Small Move: Disinterest. Waiting for catalyst. Often occurs during consolidation.
Volume Climax Patterns
Buying Climax:
Extremely high volume at the end of an uptrend. Price makes new highs but closes off the highs. Often signals exhaustion of buying. Watch for reversal confirmation.
Selling Climax:
Extremely high volume at the end of a downtrend. Price makes new lows but closes off the lows. Often signals exhaustion of selling. Watch for reversal confirmation.
Climax volume represents capitulation: the final flush of weak hands.
Accumulation Volume Patterns
Accumulation occurs when informed buyers quietly build positions:
Characteristics:
Price moves sideways or slightly down. Volume is steady or increasing. Down moves have less follow-through. Narrow range with contained price action.
Volume Signature:
Higher volume on up moves within the range. Lower volume on down moves within the range. Price fails to break support despite tests.
Accumulation precedes markup (price increase). The longer the accumulation, the larger the subsequent move.
Distribution Volume Patterns
Distribution occurs when informed sellers quietly exit positions:
Characteristics:
Price moves sideways or slightly up. Volume is steady or increasing. Up moves have less follow-through. Narrow range with contained price action.
Volume Signature:
Higher volume on down moves within the range. Lower volume on up moves within the range. Price fails to break resistance despite tests.
Distribution precedes markdown (price decrease). Often harder to identify than accumulation.
Volume Dry-Up
Sudden volume decrease can be significant:
Before Breakouts: Volume often decreases just before significant breakouts. The “calm before the storm.” Coiled energy ready to release.
During Pullbacks: Low volume on pullbacks within a trend is healthy. Indicates lack of selling conviction. Pullback likely to end, trend to resume.
At Key Levels: Volume dry-up at support or resistance suggests the level may break. No conviction to defend it.
Relative Volume
Compare current volume to average volume:
Calculation: Relative Volume = Current Volume / Average Volume over recent period
Interpretation:
Above 150%: Significantly elevated interest. Above 200%: Unusual activity, investigate why. Below 50%: Unusually quiet, may be waiting for catalyst.
Track relative volume throughout the session to detect emerging interest.
Volume and Gap Analysis
Volume on gap days provides insight:
Gap Up on High Volume: Bullish, with real buying conviction behind it. Less likely to fill the gap immediately.
Gap Up on Low Volume: Suspicious. It may lack real support, so it is more likely to fill.
Gap Down on High Volume: Bearish, with real selling conviction behind it. Less likely to fill the gap immediately.
Gap Down on Low Volume: May be an opportunity: the lack of selling conviction makes it more likely to fill.
Integrating Volume with SMC
At Order Blocks: High volume as price reaches an order block confirms institutional interest. Look for volume confirmation of OB defense.
During Liquidity Sweeps: Volume spike during sweep confirms stops were hit. Volume should increase on the reversal for confirmation.
On Structure Breaks: BOS or CHOCH should have volume confirmation. Low volume structure breaks are less reliable.
Key Takeaways
Always interpret volume in context (time of day, recent history, events). Volume + price relationship reveals conviction. Volume climaxes often signal exhaustion and potential reversal. Accumulation shows on higher volume up moves; distribution on higher volume down moves. Volume dry-up before breakouts signals coiled energy. Relative volume helps identify unusual activity. Integrate volume analysis with SMC for confirmation.