
Markets do not exist in isolation. They influence each other through economic relationships, capital flows, and sentiment. Understanding these intermarket relationships, and what it means when they diverge, adds another layer to your analysis.
Why Intermarket Analysis Matters
Markets are interconnected:
Capital Flows: Money moving from one asset class to another affects prices. Risk-on moves see money flow to equities; risk-off sees money flow to bonds and gold.
Economic Relationships: A strong dollar affects commodity prices. Interest rates affect equity valuations. Energy prices affect transportation costs and inflation.
Leading Indicators: Sometimes one market leads another. Bonds may signal equity direction. Dollar may lead gold.
Key Market Relationships
ES and NQ Correlation:
Both are US equity indices, highly correlated (typically 0.85-0.95). NQ is more volatile (beta of 1.3-1.5 to ES). Divergences can signal sector rotation or tech-specific news.
Equities and Bonds (ES and ZN/ZB):
Generally inversely correlated. Risk-on: Money moves from bonds to equities. Risk-off: Money moves from equities to bonds. Correlation can break down during Fed policy changes.
Dollar and Commodities (DXY and GC/CL):
Generally inversely correlated. Strong dollar typically means lower commodity prices. Weak dollar typically means higher commodity prices. Gold in particular has strong inverse dollar relationship.
Equities and VIX:
Strongly inversely correlated. ES falls, VIX rises (fear increases). ES rises, VIX falls (complacency). Divergences can signal turning points.
Using Correlations in Trading
Confirmation:
When correlated markets move together, the move is confirmed. ES and NQ both breaking out is more significant than ES alone. Agreement adds confidence to directional trades.
Warning Signs:
When correlated markets diverge, caution is warranted. ES making new highs while NQ lags may signal weakness. One market “seeing” something the other has not.
Risk Management:
Holding correlated positions multiplies risk. Long ES and long NQ is essentially double ES exposure. Consider correlation when sizing multiple positions.
Smart Money Technique (SMT) Divergence
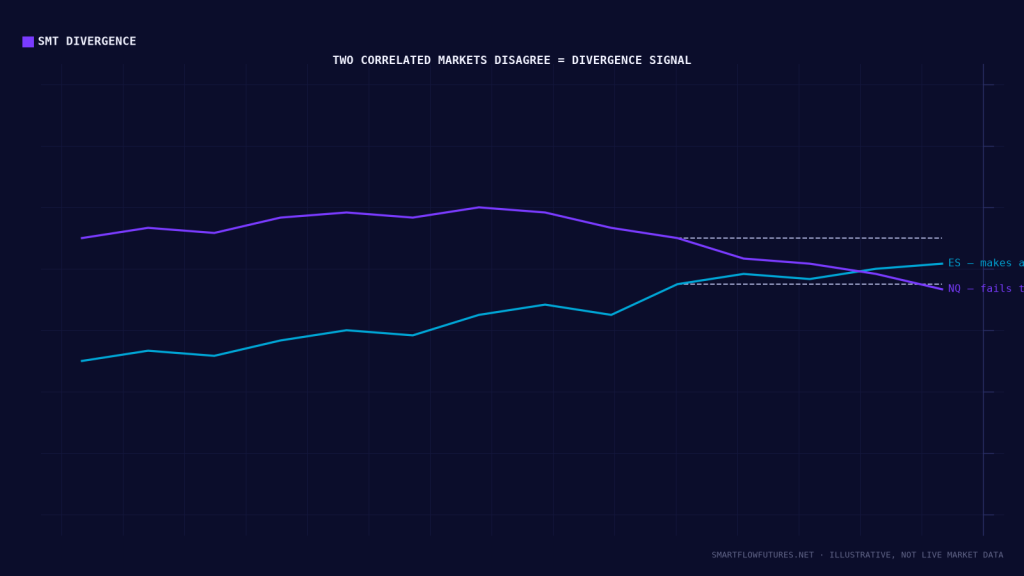
SMT divergence is an SMC concept using intermarket analysis:
The Concept:
When highly correlated markets should make the same highs or lows, divergence suggests manipulation. One market makes a higher high while the other makes a lower high. Suggests the move is not genuine.
Example:
ES makes a new high. NQ fails to make a new high (makes a lower high). This is bearish SMT divergence. Suggests the ES high may be a trap.
This works in reverse for lows. If one makes a lower low while the other holds higher, that’s bullish divergence.
Dollar and Trading Decisions
The US dollar influences many markets:
For Gold: Dollar strength is typically bearish for gold. Dollar weakness is typically bullish for gold. Check DXY before taking gold trades.
For Equities: Relationship is more complex. Generally, stable to weak dollar is bullish for equities. Very strong dollar can be bearish (hurts multinationals).
For International Trades: Strong dollar means international equities underperform in dollar terms.
Bond Yields and Equities
Rising yields (falling bond prices) affect equities:
Gradual Rise: Often reflects economic strength, can be equity positive.
Rapid Rise: Creates competition for capital, can be equity negative. Tech and growth stocks particularly sensitive.
Yield Curve: Inverted yield curve (short rates above long rates) historically signals recession risk.
Correlation Changes
Correlations are not static:
Normal Times: Standard relationships hold. Diversification works. Intermarket analysis is reliable.
Crisis Times: Correlations spike toward 1.0. Everything sells off together. Diversification fails when most needed.
Policy Shifts: Fed actions can change relationships. Quantitative easing changed bond-equity dynamics.
Be aware that historical correlations may not persist.
Practical Application
Daily Checklist:
Before trading, note: Dollar direction (DXY). Bond market (ZN or yields). VIX level and direction. Correlation status (ES vs NQ aligned?).
During Trading:
Watch for SMT divergence at key levels. Note if correlations are confirming or diverging. Use intermarket context for trade confidence.
Key Takeaways
Markets are interconnected through capital flows and economic relationships. ES and NQ correlation is high; divergence signals caution. Dollar inversely correlates with commodities, especially gold. Equities and bonds typically move inversely (risk-on/risk-off). SMT divergence uses intermarket analysis for SMC trading. Correlations change during crises and policy shifts. Use intermarket context as confirmation and risk management tool.