
Before risking real capital, you must validate that your trading approach has a genuine edge. Backtesting allows you to test your strategy against historical data, measuring its performance across many trades. Proper backtesting builds confidence and reveals weaknesses before they cost you money.
Why Backtesting Matters
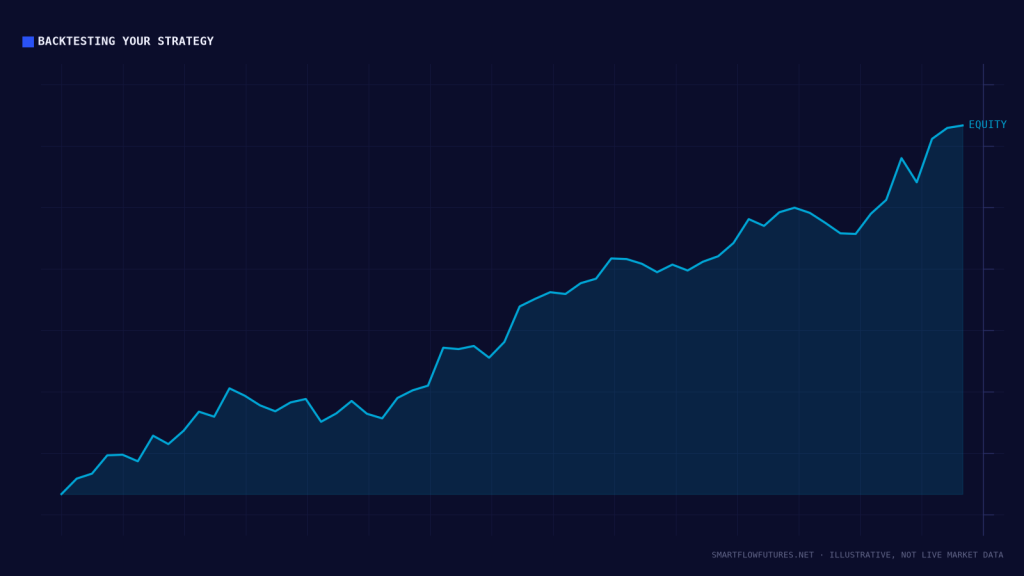
Backtesting serves multiple purposes:
Edge Validation: Does your strategy actually have positive expectancy? Backtesting provides statistical evidence.
Parameter Optimization: What settings work best? Stop distances, targets, timeframes—backtesting helps refine these.
Drawdown Understanding: How bad can it get? Backtesting reveals maximum drawdowns you should expect.
Confidence Building: Knowing your strategy has worked historically helps you execute during live trading stress.
Types of Backtesting
Manual Backtesting:
Review historical charts and identify where your setups occurred. Record entries, stops, targets, and outcomes. Most time-consuming but provides best understanding. Forces you to confront every trade decision.
Automated Backtesting:
Code your rules and run them against historical data. Fast and covers large data sets. Limited to rules that can be precisely coded. May miss nuances that discretionary judgment catches.
Hybrid Approach:
Use automation to find potential setups. Manually review each setup for final validation. Balances speed with accuracy.
Proper Backtesting Process
Step 1: Define Your Rules
Before testing, write out your complete trading rules. Entry criteria (specific, not vague). Stop loss placement. Target selection. Any filters or conditions.
Rules must be specific enough that someone else could follow them.
Step 2: Select Sample Period
Choose a representative historical period. Include both trending and ranging markets. Include both bullish and bearish phases. Minimum 100-200 trades for statistical significance.
Step 3: Test Blind
Review charts without knowing what happened next. Cover up the right side of the chart if manually testing. Make trade decisions without hindsight. Record entries as they would have occurred in real-time.
Step 4: Record Everything
For each trade, log: date/time, entry price, stop price, target price, actual exit price, R-multiple result, notes on execution.
Step 5: Calculate Statistics
After testing is complete, calculate: total trades, win rate, average win (in R), average loss (in R), expectancy, maximum drawdown, profit factor.
Statistical Significance
How many trades do you need?
Minimum 30 trades: Gives rough indication but high variance.
100 trades: More reliable statistics, still some variance.
200+ trades: Good statistical confidence.
More trades reduce the impact of luck. A strategy that wins 10 of 15 trades could be luck. A strategy that wins 110 of 200 trades is more likely a genuine edge.
Common Backtesting Mistakes
Hindsight Bias: “I would have seen that coming.” No, you would not have. Be honest about what was visible at the time.
Curve Fitting: Adjusting rules to fit historical data perfectly. Results in rules that work on the past but fail in the future.
Survivorship Bias: Only testing periods where your strategy would have worked. Include all market conditions.
Ignoring Slippage and Costs: Real trading has slippage and commissions. Account for these in your testing.
Cherry-Picking: Subconsciously selecting only winning examples. Follow your rules mechanically, taking all setups.
Interpreting Results
Positive Expectancy: (Win Rate x Avg Win) – (Loss Rate x Avg Loss) should be positive. This is required but not sufficient.
Acceptable Drawdown: Can you psychologically handle the max drawdown shown? If your backtest shows 30% max drawdown, expect 30% or more in live trading.
Consistent Results: Does the strategy work across different market conditions? A strategy that only works in trends has limited applicability.
Realistic Expectations: Extraordinary backtesting results are usually curve-fitting. Modest, consistent results are more likely to persist.
Out-of-Sample Testing
After initial backtesting:
Reserve a portion of data that you did not test on. Test your finalized rules on this “out-of-sample” data. If results hold, your edge is more likely real. If results differ significantly, you may have curve-fit.
Key Takeaways
Backtesting validates your edge before risking real capital. Define specific rules before testing—no vague criteria. Test blind without hindsight; record everything. Minimum 100 trades for basic statistical significance, 200+ preferred. Avoid curve fitting by testing out-of-sample data. Modest, consistent results beat extraordinary backtests that likely will not persist.