
Professional traders think in terms of R-multiples rather than dollar amounts. This standardized approach allows for objective assessment of trading performance regardless of position size or account balance. Understanding R-multiples is fundamental to evaluating and improving your trading.
What is an R-Multiple?
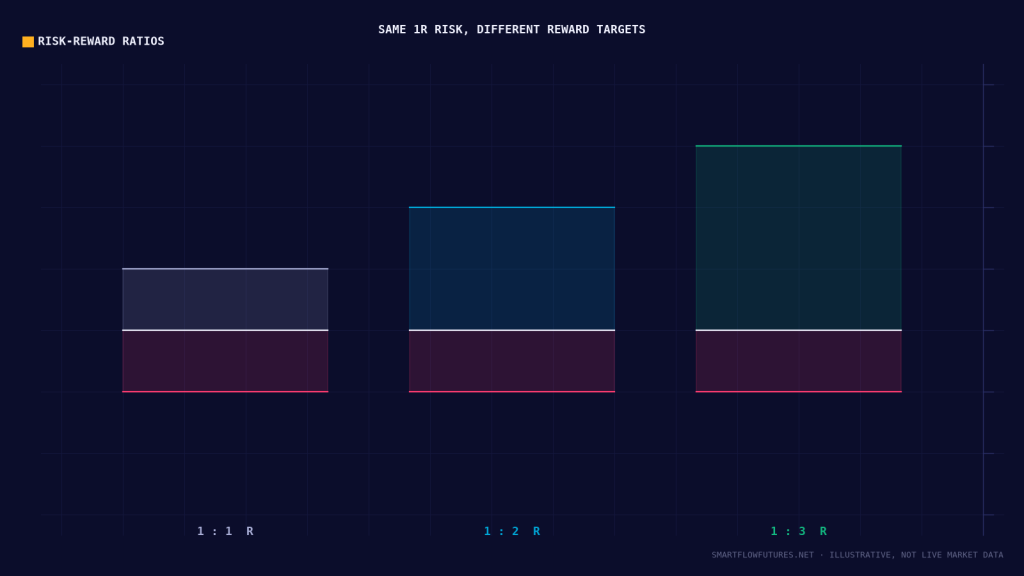
R represents your initial risk on a trade. An R-multiple expresses your result as a multiple of that risk.
Examples:
You risk $500 on a trade (1R = $500).
If you make $500, result = +1R.
If you make $1,000, result = +2R.
If you lose $500 (full stop), result = -1R.
If you lose $250 (early exit), result = -0.5R.
By standardizing results to R, you can compare trades across different markets, position sizes, and time periods.
Why Think in R-Multiples?
Removes Dollar Bias: A $5,000 profit means nothing without context. Is it from a $50,000 account (10%) or a $500,000 account (1%)? R-multiples provide that context.
Enables Comparison: A +2R trade on ES is equivalent to a +2R trade on NQ, regardless of contract value differences.
Focuses on Process: When you think in R, you focus on executing your system rather than obsessing over dollar amounts.
Risk-Reward Ratio Explained
The risk-reward ratio describes potential profit relative to potential loss:
1:1 Risk-Reward: Target equals stop loss. Win $500 or lose $500.
1:2 Risk-Reward: Target is twice the stop loss. Win $1,000 or lose $500.
1:3 Risk-Reward: Target is three times the stop loss. Win $1,500 or lose $500.
Higher risk-reward ratios allow profitability with lower win rates, but may also reduce win rate due to larger targets.
Win Rate and Risk-Reward Relationship
There is a mathematical relationship between win rate and required risk-reward:
Breakeven Requirements:
At 1:1 R:R, you need 50% win rate to break even.
At 1:2 R:R, you need 33% win rate to break even.
At 1:3 R:R, you need 25% win rate to break even.
The formula: Breakeven Win Rate = 1 / (1 + Risk-Reward Ratio)
This means a system with 40% win rate can still be profitable if average winners are 2R or larger.
Calculating Expectancy
Expectancy tells you how much you can expect to make per R risked over time:
The Formula:
Expectancy = (Win Rate x Average Win in R) – (Loss Rate x Average Loss in R)
Example:
Win Rate: 45%
Average Win: 2.5R
Average Loss: 1R
Expectancy = (0.45 x 2.5) – (0.55 x 1) = 1.125 – 0.55 = 0.575R
This means you can expect to make 0.575R for every trade taken, on average. Over 100 trades risking $500 each, expected profit would be 57.5R or $28,750.
Practical R-Multiple Targets
Minimum Target: 1.5R – Ensures that even with a 50% win rate, you are profitable.
Standard Target: 2R – Comfortable balance between achievability and profitability.
Extended Target: 3R+ – For runners and strong trend moves. Lower hit rate but significant contribution to results.
Managing Trades in R-Terms
Partial Profit Strategy:
Take 50% at 1R (locks in 0.5R).
Take 30% at 2R (adds 0.6R, total 1.1R).
Let 20% run to 3R or trailing stop.
This approach ensures you capture profits while allowing for larger moves.
Breakeven Stop:
Move stop to breakeven after 1R of profit. Worst case becomes 0R instead of -1R. Significantly improves expectancy over time.
Tracking Your R-Performance
Record every trade in R-multiples:
Trade 1: +2.1R
Trade 2: -1R
Trade 3: +1.8R
Trade 4: -0.5R (early exit)
Trade 5: +3.2R
Total: +5.6R over 5 trades = 1.12R per trade
This tells you your system is performing well regardless of the dollar amounts involved.
R-Multiple Distribution
Understanding how your Rs are distributed reveals system characteristics:
Tight Distribution: Most trades cluster between -1R and +2R. Consistent but limited upside. Requires higher win rate.
Wide Distribution: Some large winners (+5R, +10R) offset many small losses. Lower win rate acceptable. Often seen in trend-following systems.
Neither distribution is inherently better. Know your system characteristics and trade accordingly.
Common R-Multiple Mistakes
Cutting Winners Too Early: Taking +0.5R when the target was +2R. Destroys expectancy even with high win rate.
Letting Losers Run: Turning a -1R into a -2R or worse. One large loss can wipe out many winners.
Inconsistent Risk: Risking different amounts on different trades makes R-tracking meaningless.
Ignoring R in Trade Selection: Taking trades with poor R potential because of confidence or FOMO.
Building an R-Focused Mindset
Shift your thinking:
Before: “I made $2,000 today!”
After: “I made +4R today.”
Before: “This trade has a $1,500 target.”
After: “This trade has a 3R target.”
Before: “I lost a lot of money.”
After: “I had a -1R loss, which is within my system parameters.”
R-thinking removes emotion and keeps you focused on process over outcomes.
Key Takeaways
R represents your initial risk; results are measured as multiples of R. Higher risk-reward ratios allow profitability with lower win rates. Calculate expectancy to understand your average R per trade. Take partial profits to lock in R while allowing runners. Track all trades in R to objectively assess performance. Think in R, not dollars, to maintain emotional discipline.