
Drawdown is the peak-to-trough decline in your trading account. Understanding and managing drawdown is essential for long-term survival. Every trading system experiences drawdowns; how you handle them determines whether you survive to profit from eventual recovery.
Understanding Drawdown
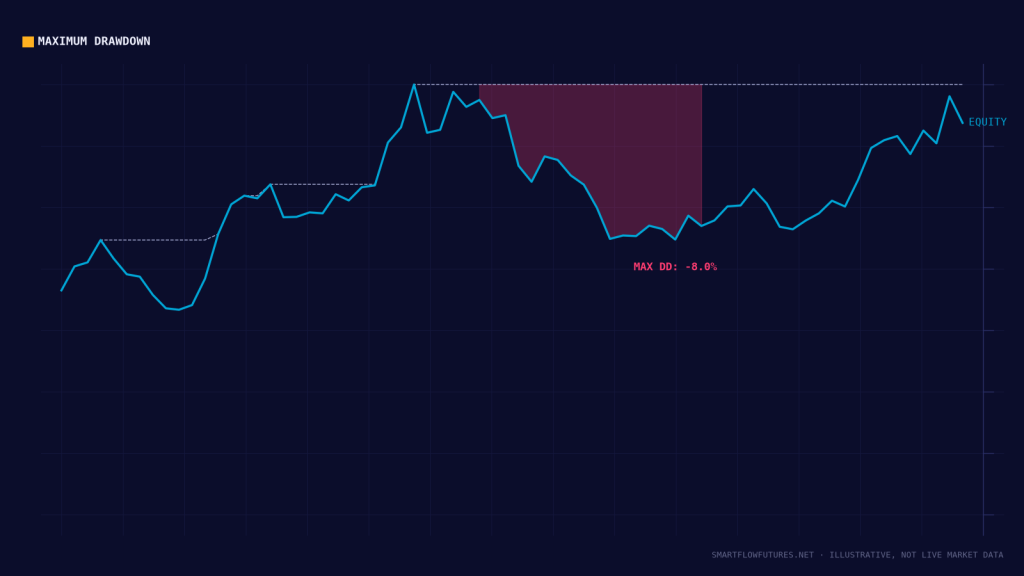
Definition: Drawdown measures how much your account has declined from its highest point (peak) to its current or lowest point (trough) before making a new high.
Example:
Account reaches peak of $60,000.
Account declines to $48,000.
Current Drawdown = ($60,000 – $48,000) / $60,000 = 20%
Drawdown persists until you make a new equity high. You could be in drawdown for weeks or months even while making some profitable trades.
Maximum Drawdown (MDD)
The maximum drawdown is the largest peak-to-trough decline experienced over a trading period. This is the metric that defines the worst-case scenario for your strategy.
If a strategy has a historical MDD of 25%, you should expect to experience at least that level of drawdown in future trading—and possibly more.
Why Drawdown Matters
Recovery Mathematics:
10% drawdown requires 11% gain to recover.
20% drawdown requires 25% gain to recover.
30% drawdown requires 43% gain to recover.
50% drawdown requires 100% gain to recover.
The deeper the drawdown, the harder recovery becomes. A 50% drawdown is often a death sentence for a trading account.
Psychological Impact: Deep drawdowns cause emotional distress, leading to poor decisions, abandonment of strategy, or revenge trading that deepens the drawdown further.
Setting Drawdown Limits
Establish limits before you start trading:
Daily Drawdown Limit: Maximum acceptable loss in a single day. Recommended: 2-3% of account. When hit, stop trading for the day.
Weekly Drawdown Limit: Maximum acceptable loss in a week. Recommended: 5-6% of account. When hit, reduce size or take the week off.
Maximum Drawdown Limit: The absolute maximum you will tolerate. Recommended: 15-20% of account. When hit, stop trading and reassess everything.
Drawdown and Position Sizing
Your position sizing directly affects potential drawdown:
At 1% Risk Per Trade:
10 consecutive losses = 9.6% drawdown
20 consecutive losses = 18.2% drawdown
At 2% Risk Per Trade:
10 consecutive losses = 18.3% drawdown
20 consecutive losses = 33.2% drawdown
Smaller position sizes provide a buffer against losing streaks, keeping drawdowns manageable.
Dealing with Drawdown
Step 1: Recognize It Is Normal
Every trading system has drawdowns. Even the best traders experience significant losing periods. Drawdown does not necessarily mean your system is broken.
Step 2: Review Your Trading
Are you following your system? If yes, the drawdown is within expected parameters. If no, the drawdown may be self-inflicted through poor execution.
Step 3: Reduce Size If Necessary
During extended drawdowns, consider reducing position size. This slows the bleeding and preserves capital for recovery.
Step 4: Avoid Revenge Trading
Do not increase size to “make it back faster.” This is the most common cause of catastrophic drawdowns.
Drawdown Recovery
Recovery from drawdown requires patience:
Time to Recover: If your system makes 0.5R per trade on average and you are in a 10R drawdown, you need approximately 20 trades to recover. At 2 trades per day, that is 10 trading days minimum.
Do Not Chase: Trying to accelerate recovery by taking more trades or larger positions usually backfires.
Trust the Process: If your system has positive expectancy, recovery will come through consistent execution, not through heroic efforts.
Comparing Drawdown Metrics
Maximum Drawdown (MDD): Single worst drawdown experienced. Important for understanding worst-case scenario.
Average Drawdown: Mean of all drawdowns. Indicates typical drawdown experience.
Drawdown Duration: How long you remain in drawdown before recovery. Some strategies have frequent small drawdowns; others have rare but prolonged ones.
Recovery Time: How long it takes to make new equity highs after a drawdown. Related to system expectancy and trade frequency.
Drawdown and System Evaluation
Use drawdown metrics to evaluate strategies:
Return to Drawdown Ratio: Annual Return / Maximum Drawdown. A ratio of 2 or higher is generally good. Example: 40% annual return / 20% MDD = 2.0 ratio.
Calmar Ratio: Similar to above but uses average annual return over 3 years divided by MDD. Above 1.0 is acceptable; above 3.0 is excellent.
Preparing for Drawdown
Accept that drawdown will happen:
Calculate expected MDD based on your strategy parameters. Have a plan for when drawdown limits are approached. Ensure your position sizing keeps MDD within acceptable bounds. Build psychological resilience through simulation and small-size trading.
Key Takeaways
Drawdown is the decline from equity peak to trough—every trader experiences it. Recovery becomes exponentially harder as drawdown deepens. Set daily, weekly, and maximum drawdown limits before trading. Position sizing is the primary tool for controlling drawdown. During drawdowns, reduce size rather than increase it. Trust your system through drawdowns if following your rules; review execution if not.