
When you trade multiple positions, correlation risk can multiply your exposure in ways that are not immediately obvious. Two trades that each risk 1% can become effectively 2% risk if the positions are highly correlated. Understanding and managing correlation is essential for traders who hold multiple positions.
What is Correlation?
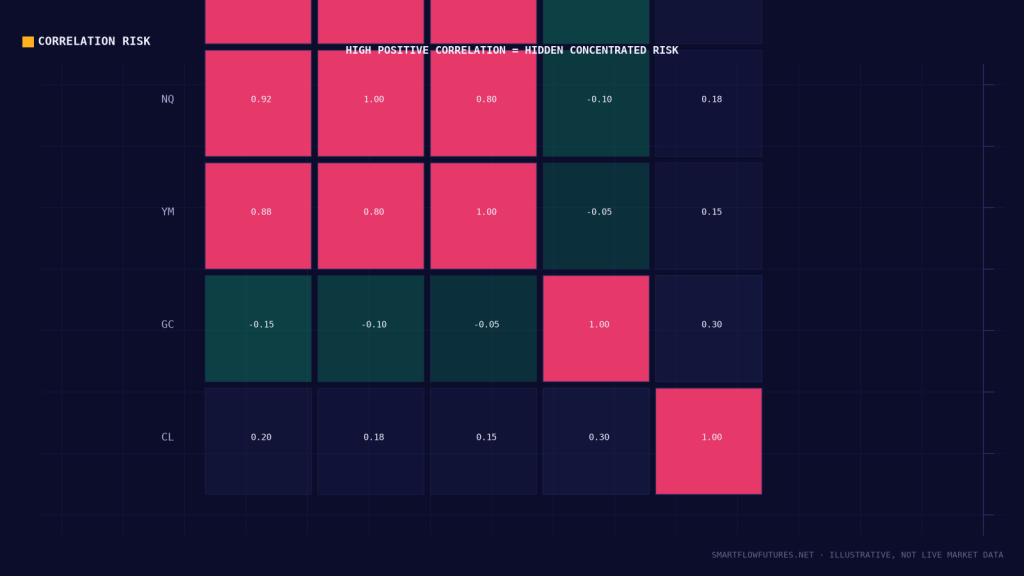
Correlation measures how two assets move in relation to each other:
Positive Correlation (+1): Assets move in the same direction. When one goes up, the other typically goes up too.
Negative Correlation (-1): Assets move in opposite directions. When one goes up, the other typically goes down.
No Correlation (0): Assets move independently. One provides no information about the other.
Common Correlations in Futures
Highly Correlated (0.8+):
ES and NQ (both US equity indices)
ES and YM (both US equity indices)
Gold and Silver (both precious metals)
EUR/USD and GBP/USD (both dollar pairs)
Moderately Correlated (0.4-0.7):
NQ and Gold (risk-on/risk-off relationship varies)
ES and Crude Oil (economic activity connection)
Bonds and Gold (safe-haven overlap)
Negatively Correlated:
ES and VIX (fear index rises when stocks fall)
USD and Gold (dollar-denominated inverse)
The Hidden Risk of Correlation
Scenario:
You take a long position in ES, risking 1%.
You take a long position in NQ, risking 1%.
Your total portfolio risk appears to be 2%.
Reality:
ES and NQ have approximately 0.9 correlation.
When ES falls, NQ almost certainly falls too.
Your two 1% risks are essentially one 2% risk.
You have doubled your actual exposure.
Calculating Effective Risk
For highly correlated positions, effective risk approaches the sum of individual risks:
Position A: 1% risk
Position B: 1% risk (0.9 correlation with A)
Effective Risk ≈ 1.9% (not quite 2% due to imperfect correlation)
For uncorrelated positions:
Position A: 1% risk
Position B: 1% risk (0 correlation with A)
Effective Risk ≈ 1.4% (risk is partially diversified)
Managing Correlation Risk
Method 1: Treat Correlated Positions as One
If you want long index exposure, choose ES or NQ, not both. Allocate your total desired risk to one instrument. This is the simplest approach.
Method 2: Reduce Size on Each
If you want positions in both ES and NQ, reduce each to 0.5% risk. Total effective risk then approximates your 1% target.
Method 3: Diversify Across Uncorrelated Markets
Pair an ES trade with a Gold trade (lower correlation). The positions provide some diversification benefit.
Correlation Changes
Correlations are not static:
During Normal Markets: Correlations may be moderate. ES and Gold might have low correlation.
During Crises: Correlations often spike toward +1 or -1. The “flight to safety” causes most assets to become correlated as traders rush to safe havens.
Do not assume that historical correlations will hold during extreme events. Plan for correlation spikes in your risk management.
Practical Correlation Management
For Day Traders:
Be aware of index correlations (ES, NQ, YM). If taking multiple index trades, reduce size or treat as one position. Monitor for divergences that might create opportunities.
For Swing Traders:
Check correlation before adding positions. If holding ES long, be cautious adding NQ long. Consider uncorrelated additions like Gold or Crude to diversify.
Portfolio Heat:
Set maximum portfolio heat (total risk across all positions). Account for correlation when calculating heat. Example: 3 positions at 1% each in correlated markets equals approximately 3% heat, not less.
Using Correlation Strategically
Correlation can be used to your advantage:
Hedging: Take opposite positions in correlated markets to reduce risk. Long ES, short NQ if you believe ES will outperform.
Pairs Trading: Exploit temporary divergences in correlated markets. When correlation breaks down briefly, trade the reversion.
SMT Divergence: As covered earlier, correlation breakdowns between ES and NQ signal institutional positioning.
Key Takeaways
Correlated positions effectively multiply your risk exposure. ES, NQ, and YM are highly correlated—treating them as separate risks is dangerous. Either trade one correlated market or reduce size when trading multiple. Correlations can change, especially during market stress. Use maximum portfolio heat limits that account for correlation. Consider correlation when building multi-position portfolios.