
Win rate is the most common trading metric, but it is also one of the most misleading. A 70% win rate means nothing if your losses are larger than your wins. This article covers the metrics that actually matter and how to use them.
Why Win Rate is Misleading
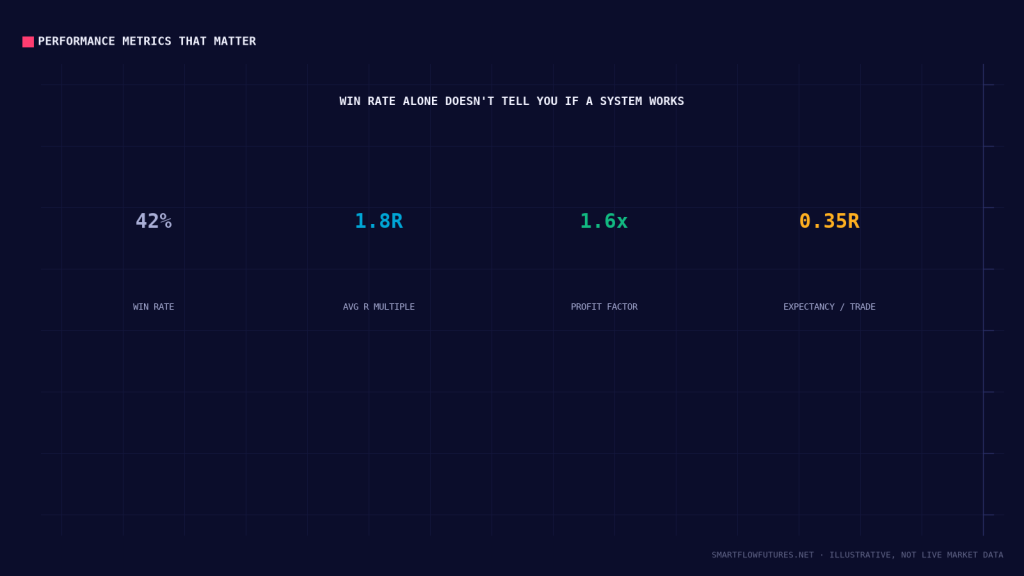
Consider two traders:
Trader A: 80% win rate. Average win: $100. Average loss: $500. Expectancy per trade: (0.80 x $100) – (0.20 x $500) = $80 – $100 = -$20. Losing trader despite high win rate.
Trader B: 40% win rate. Average win: $300. Average loss: $100. Expectancy per trade: (0.40 x $300) – (0.60 x $100) = $120 – $60 = +$60. Profitable trader despite low win rate.
Win rate alone tells you nothing about profitability.
Expectancy: The Key Metric
Formula:
Expectancy = (Win Rate x Average Win) – (Loss Rate x Average Loss)
In R-Terms:
Expectancy = (Win Rate x Avg R on Wins) – (Loss Rate x Avg R on Losses)
Expectancy tells you how much you expect to make per trade on average. Positive expectancy means your system is profitable over time. This is the single most important metric.
Example:
Win Rate: 55%. Avg R on Wins: 1.8R. Avg R on Losses: 1.0R (full stop). Expectancy = (0.55 x 1.8) – (0.45 x 1.0) = 0.99 – 0.45 = 0.54R per trade.
Profit Factor
Formula:
Profit Factor = Gross Profits / Gross Losses
A profit factor above 1.0 means you are profitable. Above 1.5 is good. Above 2.0 is excellent. Below 1.0 means you are losing money.
Example:
Total wins: $5,000. Total losses: $3,000. Profit Factor = 5,000 / 3,000 = 1.67.
Average R-Multiple
Formula:
Average R = Total R Gained / Number of Trades
This tells you your average result per trade in terms of risk units. Positive average R means profitable system. Larger average R means more efficient system.
Target: Aim for average R of 0.3 to 0.5 or higher.
Maximum Drawdown
Definition: The largest peak-to-trough decline in your equity.
Maximum drawdown tells you the worst period you have experienced. Important for: setting realistic expectations, determining if you can psychologically handle the system, and position sizing decisions.
Healthy Range: Keep max drawdown under 20% of account. Under 10% is more conservative and recommended.
R-Multiple Distribution
Look at how your R-multiples are distributed:
Tight Distribution: Most trades close to 0R (small wins and losses). More consistent but limited upside.
Wide Distribution: Mixture of large wins, large losses, and everything between. More volatile but potential for big wins.
Neither is inherently better—understand what your system produces and whether it matches your psychology.
Trade Frequency
Often overlooked but important:
Formula:
Expected Monthly Profit = Expectancy x Trades per Month
A system with 0.5R expectancy taking 20 trades per month expects 10R per month. A system with 1.0R expectancy taking 5 trades per month expects 5R per month. The first system may be better despite lower per-trade expectancy.
Metrics to Track
Primary Metrics (Calculate Weekly):
Win rate. Average R-multiple. Expectancy. Profit factor. Maximum drawdown.
Secondary Metrics (Calculate Monthly):
Trade frequency. Best trade / Worst trade. Win streak / Loss streak. Time in market.
Using Metrics for Improvement
Low Win Rate but Profitable: This is fine. Focus on maintaining your average win size. Do not try to increase win rate at the expense of winners.
High Win Rate but Not Profitable: Your losses are too large. Focus on: cutting losses faster, better stop placement, and not letting winners become losers.
Negative Expectancy: Something is fundamentally wrong. Review: setup quality, entry timing, stop placement, and target selection. Consider if your edge is real.
Key Takeaways
Win rate alone is meaningless without win/loss size context. Expectancy is the key metric: (Win Rate x Avg Win) – (Loss Rate x Avg Loss). Profit factor above 1.5 indicates a healthy system. Track maximum drawdown to understand worst-case scenarios. Calculate metrics weekly and use them to guide improvement.