
Understanding what a “perfect” trade looks like helps you recognize similar opportunities. This article walks through a complete trade from initial analysis to final exit, explaining the reasoning at each step.
Setting the Scene
Market: NQ (Nasdaq 100 E-mini futures)
Date: A typical trading day
Session: New York AM session
Account: Using 1 contract with $50,000 account
Step 1: Higher Timeframe Analysis (Daily)
Observations:
Daily chart shows bullish structure, with higher highs and higher lows over the past two weeks. Price recently broke above a consolidation range. A bullish order block exists from the breakout at 17,600. Current price: 17,850, having pulled back from recent highs of 17,950.
Bias: Bullish. Looking for long opportunities.
Key Levels: Bullish OB at 17,600. Recent high (liquidity) at 17,950. Support at 17,700 (prior resistance turned support).
Step 2: Trading Timeframe Analysis (15M)
Observations:
15M shows a retracement in progress after the rally to 17,950. A bullish FVG exists between 17,720 and 17,750 from the recent impulse. An order block sits at 17,680-17,710 (last down candle before the breakout). Price is currently at 17,780, moving lower toward these levels.
Setup Identification:
Looking for price to retrace into the FVG zone (17,720-17,750). If we get confluence with Order Flow at this level, long entry opportunity. Target: return to 17,950 (recent high) and beyond.
Step 3: Pre-Trade Planning
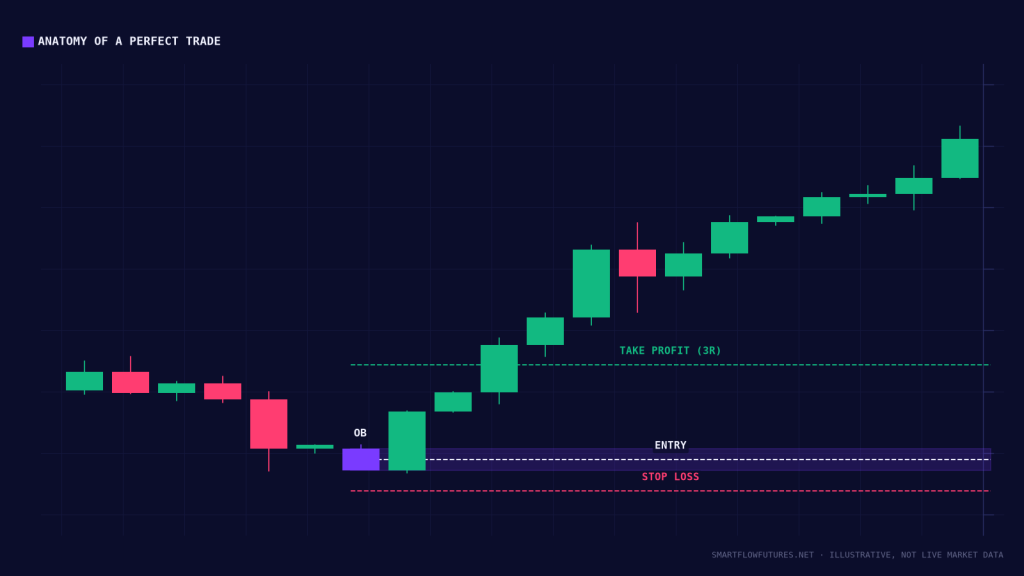
Entry Zone: 17,720-17,750 (the FVG)
Entry Trigger: Bullish rejection or 5M CHOCH within the zone, confirmed by Order Flow (absorption or stacked buying imbalances).
Stop Loss: Below 17,680 (below the order block). This is 40-70 points from entry zone, so risk is $40-70 per micro contract or $800-1,400 per standard contract.
Targets: Target 1: 17,850 (prior structure, approximately 100-130 points). Target 2: 17,950 (recent high, approximately 200-230 points). This gives potential R:R of 2:1 to 3:1+.
Position Size: With $50,000 account and 1% risk ($500), can trade 1 MNQ contract with 50-point stop (risk = $50). Or 1/2 NQ contract if broker allows, or wait for tighter stop opportunity.
Step 4: Execution (5M Chart + Footprint)
The Approach:
Price drops to 17,740 (inside the FVG). On the 5M chart, a long lower wick forms, showing rejection.
Order Flow Confirmation:
Footprint shows: Heavy selling volume as price entered 17,740. Buying absorption visible. Bids being refreshed. Stacked buying imbalances on the rejection candle. Delta shifts from negative to positive.
The Entry:
Enter long at 17,755 (after 5M candle closes bullish). Stop at 17,695 (below order block, 60 points risk). Target 1 at 17,850 (95 points, 1.6R). Target 2 at 17,950 (195 points, 3.25R).
Step 5: Trade Management
Initial Phase:
Price moves to 17,780 (+25 points). Delta remains positive. Footprint shows continued buying imbalances. No action needed. Let it run.
At Target 1 (17,850):
Price reaches 17,850 (+95 points from entry). Take 50% of position. Move stop to breakeven (17,755) on remaining 50%.
Continuing the Trade:
Price pulls back to 17,810. Stop is at breakeven, so worst case is 0.8R profit (from the partial). Price bounces and continues higher. Trail stop to below 17,810 swing low.
At Target 2 (17,950):
Price reaches 17,950 (+195 points from entry). Exit remaining position.
Step 6: Trade Results
First Half: 50% at 95 points = 47.5 points equivalent
Second Half: 50% at 195 points = 97.5 points equivalent
Total Gain: 145 points equivalent
R-Multiple: 145 / 60 = 2.4R
A well-executed trade that followed the plan and used both SMC structure and Order Flow confirmation.
What Made This Trade “Perfect”
Higher Timeframe Alignment: Daily bias was bullish. We traded in the direction of the larger trend.
Clear SMC Setup: FVG and order block confluence provided a defined entry zone.
Order Flow Confirmation: Did not enter blindly. Waited for absorption and delta shift to confirm institutional interest.
Defined Risk: Stop was logical (below structure) and risk was calculated before entry.
Proper Management: Took partial profits, moved stop to breakeven, let winner run.
Discipline: Followed the plan without emotional deviation.
Key Takeaways
Perfect trades combine higher timeframe alignment, clear SMC setup, and Order Flow confirmation. Pre-trade planning defines entry, stop, and targets before execution. Wait for confirmation rather than entering blindly at levels. Scale out of winners and protect profits with trailing stops. The process matters more than any single trade outcome.