
Smart Money Tool (SMT) divergence is an advanced technique that reveals institutional activity by analyzing the relationship between correlated markets. When markets that normally move together begin to diverge, it signals that smart money is positioning for a move.
Understanding SMT Divergence
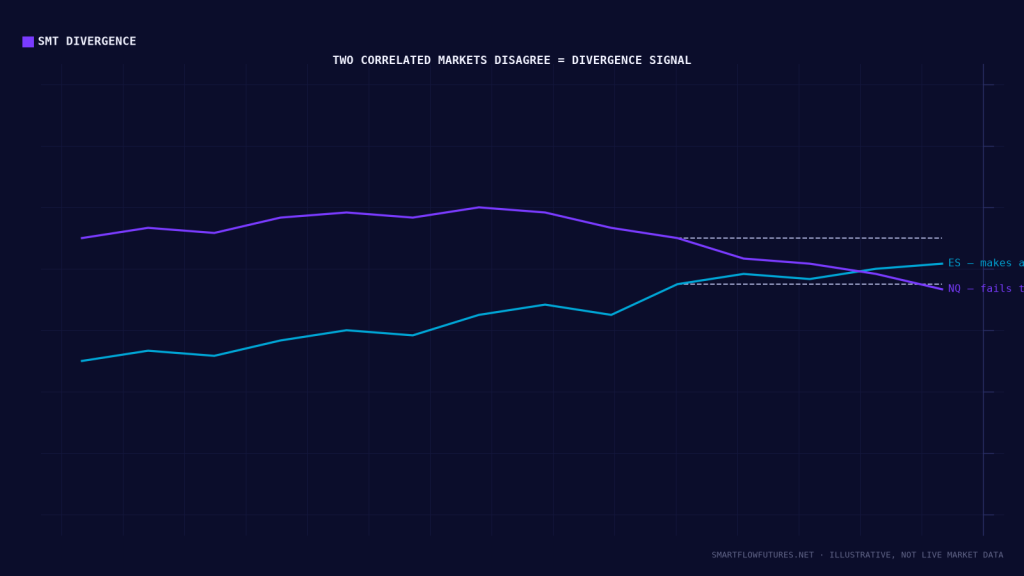
Correlated markets typically move in tandem. When the S&P 500 rallies, the Nasdaq usually rallies too. When the Dollar strengthens, Dollar-denominated assets often weaken together. SMT divergence occurs when this correlation breaks down temporarily.
The divergence reveals institutional intent: one market is being accumulated or distributed while the other shows the opposite behavior. This discrepancy often precedes significant moves as the markets eventually realign.
Types of SMT Divergence
Bullish SMT Divergence:
Market A makes a lower low. Market B (correlated) makes a higher low or equal low. This suggests accumulation is occurring in Market B. Expect bullish reversal in both markets, with Market B leading.
Bearish SMT Divergence:
Market A makes a higher high. Market B (correlated) makes a lower high or equal high. This suggests distribution is occurring in Market B. Expect bearish reversal in both markets, with Market B leading.
Common SMT Pairs for Futures
Index Futures:
ES (S&P 500) vs NQ (Nasdaq 100) – Most common pair for US futures traders. ES vs YM (Dow Jones) – Another reliable pairing. NQ vs YM – Can show tech vs industrial divergence.
Currency Correlations:
DXY (Dollar Index) vs EUR/USD – Inverse correlation. GBP/USD vs EUR/USD – Positive correlation.
Commodity Pairs:
Gold vs Silver – Generally correlated, silver more volatile. Crude Oil vs Natural Gas – Energy sector correlation.
Identifying SMT Divergence
Step 1: Choose Your Pairs
Select markets with known correlation. For index futures, ES and NQ are the primary pair to monitor.
Step 2: Identify Swing Points
On both charts, mark the recent swing highs and swing lows. Use the same timeframe for both markets.
Step 3: Compare Structure
When Market A makes a new swing high or low, check what Market B is doing. Are they in agreement or diverging?
Step 4: Confirm Divergence
True SMT divergence shows clear disagreement: one market making new extremes while the other fails to confirm.
Trading SMT Divergence
The Setup:
Identify clear divergence between your chosen pair. Determine which market is showing relative strength or weakness. Wait for price to reach a significant SMC level (order block, liquidity sweep). Look for lower timeframe confirmation of reversal.
Entry Approach:
Trade the market showing strength for longs, weakness for shorts. Enter after confirmation of reversal in the leading market. Use the lagging market for confirmation as it follows.
Example:
NQ makes a higher high, but ES makes a lower high (bearish SMT divergence). Price is at a premium zone with a bearish order block. Enter short on ES (the weaker market) after lower timeframe CHOCH. Target the recent swing low.
SMT Divergence and Liquidity
SMT divergence often occurs around liquidity events:
One market sweeps liquidity (makes a new high/low). The correlated market fails to sweep (shows divergence). The market that swept liquidity often reverses. The divergence confirms the sweep was a trap, not continuation.
This combination of liquidity sweep plus SMT divergence creates high-probability reversal setups.
Timeframes for SMT
SMT divergence appears on all timeframes, but significance varies:
Daily/Weekly: Most significant. Major reversals can follow. Suitable for swing trading.
4H/1H: Significant for intraday trends. Good for day trading setups.
15M/5M: Useful for refining entries. Less significant on its own but valuable for timing.
Higher timeframe divergences carry more weight. A weekly SMT divergence is a major signal.
Practical Application
Incorporate SMT analysis into your routine:
Pre-Session: Check ES vs NQ (or your chosen pair) for divergences on higher timeframes. Note which market is showing relative strength.
During Session: Monitor for divergences at key levels. When price approaches your zones, check the correlated market.
For Entries: Use SMT divergence as confirmation for your SMC setups. A liquidity sweep with SMT divergence is a high-conviction trade.
Limitations of SMT
SMT is powerful but not perfect:
Correlations can change or break down for extended periods. False divergences occur, especially on lower timeframes. Requires monitoring multiple markets simultaneously. Works best with other confluence factors.
Key Takeaways
SMT divergence reveals institutional positioning through correlation breakdowns. Bullish SMT: one market makes a lower low while the other holds higher. Bearish SMT: one market makes a higher high while the other fails. Common pairs include ES/NQ, ES/YM for index futures. Combine SMT divergence with liquidity sweeps and SMC levels for best results.