
Risk of Ruin: Understanding Probability in Trading
Learn the mathematics behind trading survival and why proper position sizing is the difference between success and account destruction.
Risk of Ruin is the probability that you will lose your entire trading account or enough of it that you can no longer trade effectively. Understanding this concept mathematically transforms how you think about position sizing and risk management. Many traders with winning strategies still blow up their accounts because they do not understand the math of survival. This article makes the numbers clear.
What is Risk of Ruin?
Definition
Risk of Ruin (RoR) is the mathematical probability that a series of losses will reduce your account below a functional level before your edge has time to play out. Even with a positive expectancy strategy, poor position sizing can lead to ruin through an unlucky sequence of losses.
If you flip a coin that pays 2:1 when you win (positive expectancy), you will profit over time. But if you bet your entire account each flip, you will eventually hit a loss and lose everything, despite having an edge. Position sizing bridges the gap between theoretical edge and practical survival.
The Mathematics
Where Edge = (Win Rate × Average Win) – (Loss Rate × Average Loss), and Capital Units = Account / Risk Per Trade.
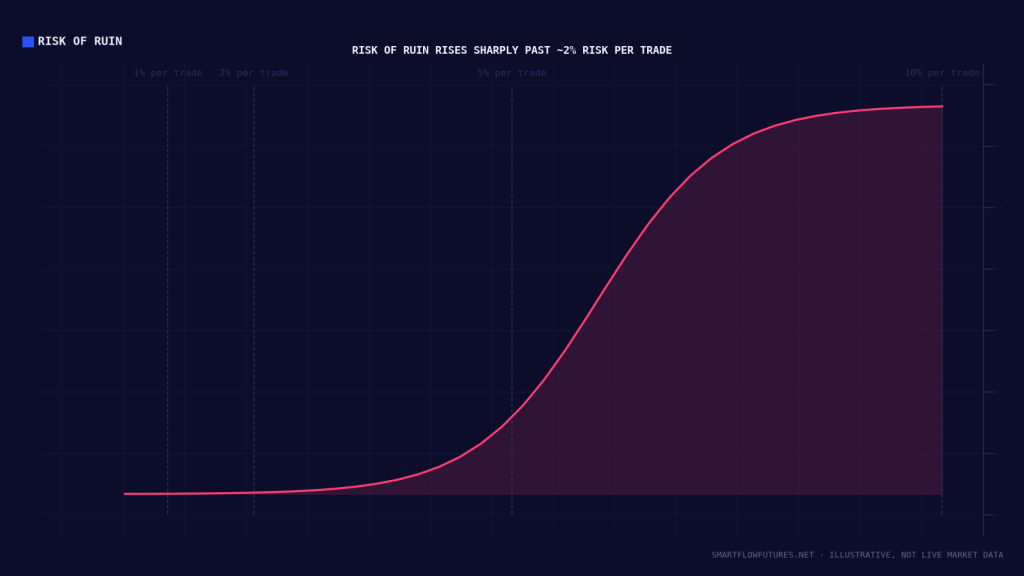
| Risk Per Trade | 50% Win Rate 1:1 RR | 50% Win Rate 2:1 RR | 60% Win Rate 1:1 RR |
|---|---|---|---|
| 1% | ~0% (very low) | ~0% | ~0% |
| 2% | ~0.1% | ~0% | ~0% |
| 5% | ~13% | ~2% | ~1% |
| 10% | ~40% | ~16% | ~9% |
| 20% | ~67% | ~44% | ~33% |
| 50% | ~99% | ~91% | ~84% |
Even with a profitable strategy (positive expectancy), risking 10% per trade gives you roughly a 1 in 3 to 1 in 6 chance of blowing up your account. Risking 20% per trade means you will likely blow up even with a winning system.
The Reality of Losing Streaks
Traders consistently underestimate how often losing streaks occur. Here is the probability of consecutive losses based on win rate:
| Consecutive Losses | 40% Win Rate | 50% Win Rate | 60% Win Rate |
|---|---|---|---|
| 3 in a row | 21.6% | 12.5% | 6.4% |
| 5 in a row | 7.8% | 3.1% | 1.0% |
| 7 in a row | 2.8% | 0.8% | 0.16% |
| 10 in a row | 0.6% | 0.1% | 0.01% |
What This Means
With a 50% win rate, you have a 1 in 8 chance of losing 3 trades in a row. Over 100 trades, you will almost certainly experience multiple 3-loss streaks and likely a 5-loss streak. If you risk 10% per trade, 5 losses in a row means a 41% drawdown. Can you emotionally and financially survive that?
Practical Implications
Guideline 1
Guideline 2
Guideline 3
Guideline 4
Drawdown Recovery Requirements
| Drawdown | Gain Needed to Recover | Reality Check |
|---|---|---|
| 10% | 11.1% | Manageable, normal part of trading |
| 20% | 25% | Significant, requires patience |
| 30% | 42.9% | Difficult, months to recover |
| 40% | 66.7% | Very difficult, strategy review needed |
| 50% | 100% | Must double account to breakeven |
| 75% | 300% | Effectively requires starting over |
| 90% | 900% | Account is destroyed |
Calculate Your Safe Risk Level
From at least 50-100 trades of backtesting or forward testing. Be conservative in your estimate.
Average winning trade size divided by average losing trade size.
What is the most you can lose before you would stop trading? 20%? 30%? Be honest.
Max Drawdown divided by expected worst losing streak. If max drawdown is 20% and you expect possible 10-loss streaks, max risk is 2%.
Risk of Ruin is the mathematical probability of account destruction. Even profitable strategies can blow up with improper position sizing. Keep risk per trade at 1-2% maximum to maintain near-zero ruin probability. Understand that losing streaks are certain to occur and size accordingly. Remember that drawdown recovery requires disproportionate gains. The goal is long-term survival that lets your edge compound, not maximum profit.